


History is a Better Teacher than Hysteria
It took 128 months, but the economic expansion borne out of the 2009 Great Recession finally ended as of February 2020.
And it did so in grand fashion.
As 2020 draws to a close, apartment investors wonder what the future will bring vis-à-vis the Seattle/Puget Sound apartment market.
To me, there is no better measure of what is likely to come than what came before. And to this point, I recommend we look to 5 Lessons from Previous Market Cycles:
- Rent Drops, then Previous Peaks Surpassed, then Exceeded
- Control What you Can, Namely Expenses
- Good Deals are Done in Bad Times
- Entitled Development Sites Vault Back
- Expansions Emerge Only in Hindsight
Hindsight is the Best Remedy for Lack of Foresight
The 10-Year Treasuries remain at historic, sub-1% lows, the DJIA continues to flirt with its 30,000 peaks. Apartment rental rates – along with occupancy rates – persist in their downward trajectory. The region’s most prolific employers, Amazon and Microsoft, increased their market value 84% and 43%, respectively. Apartment REIT values are depressed 25% – 35% and apartment values are in some cases on par with 2019, and in others down 10% – 15%.
What a year 2020 has been!
Divergent data points only heighten the financial uncertainty that defines 2020’s investment market. The future of apartment investments similarly defy prediction.
In such difficult-to-predict and challenging times, upon what can we rely?
Many proclaim – nothing!
This time is different.
We have no playbook for this.
It’s just too uncertain!
I believe history is the best predictor of future occurrences. History not repeating, but rhythming is about the only certainty upon which we can hang our hat – and I contest history remains a pretty good hat-rack!
Lesson 1 – Rents Drop, then Previous Peaks Surpassed, then Exceeded
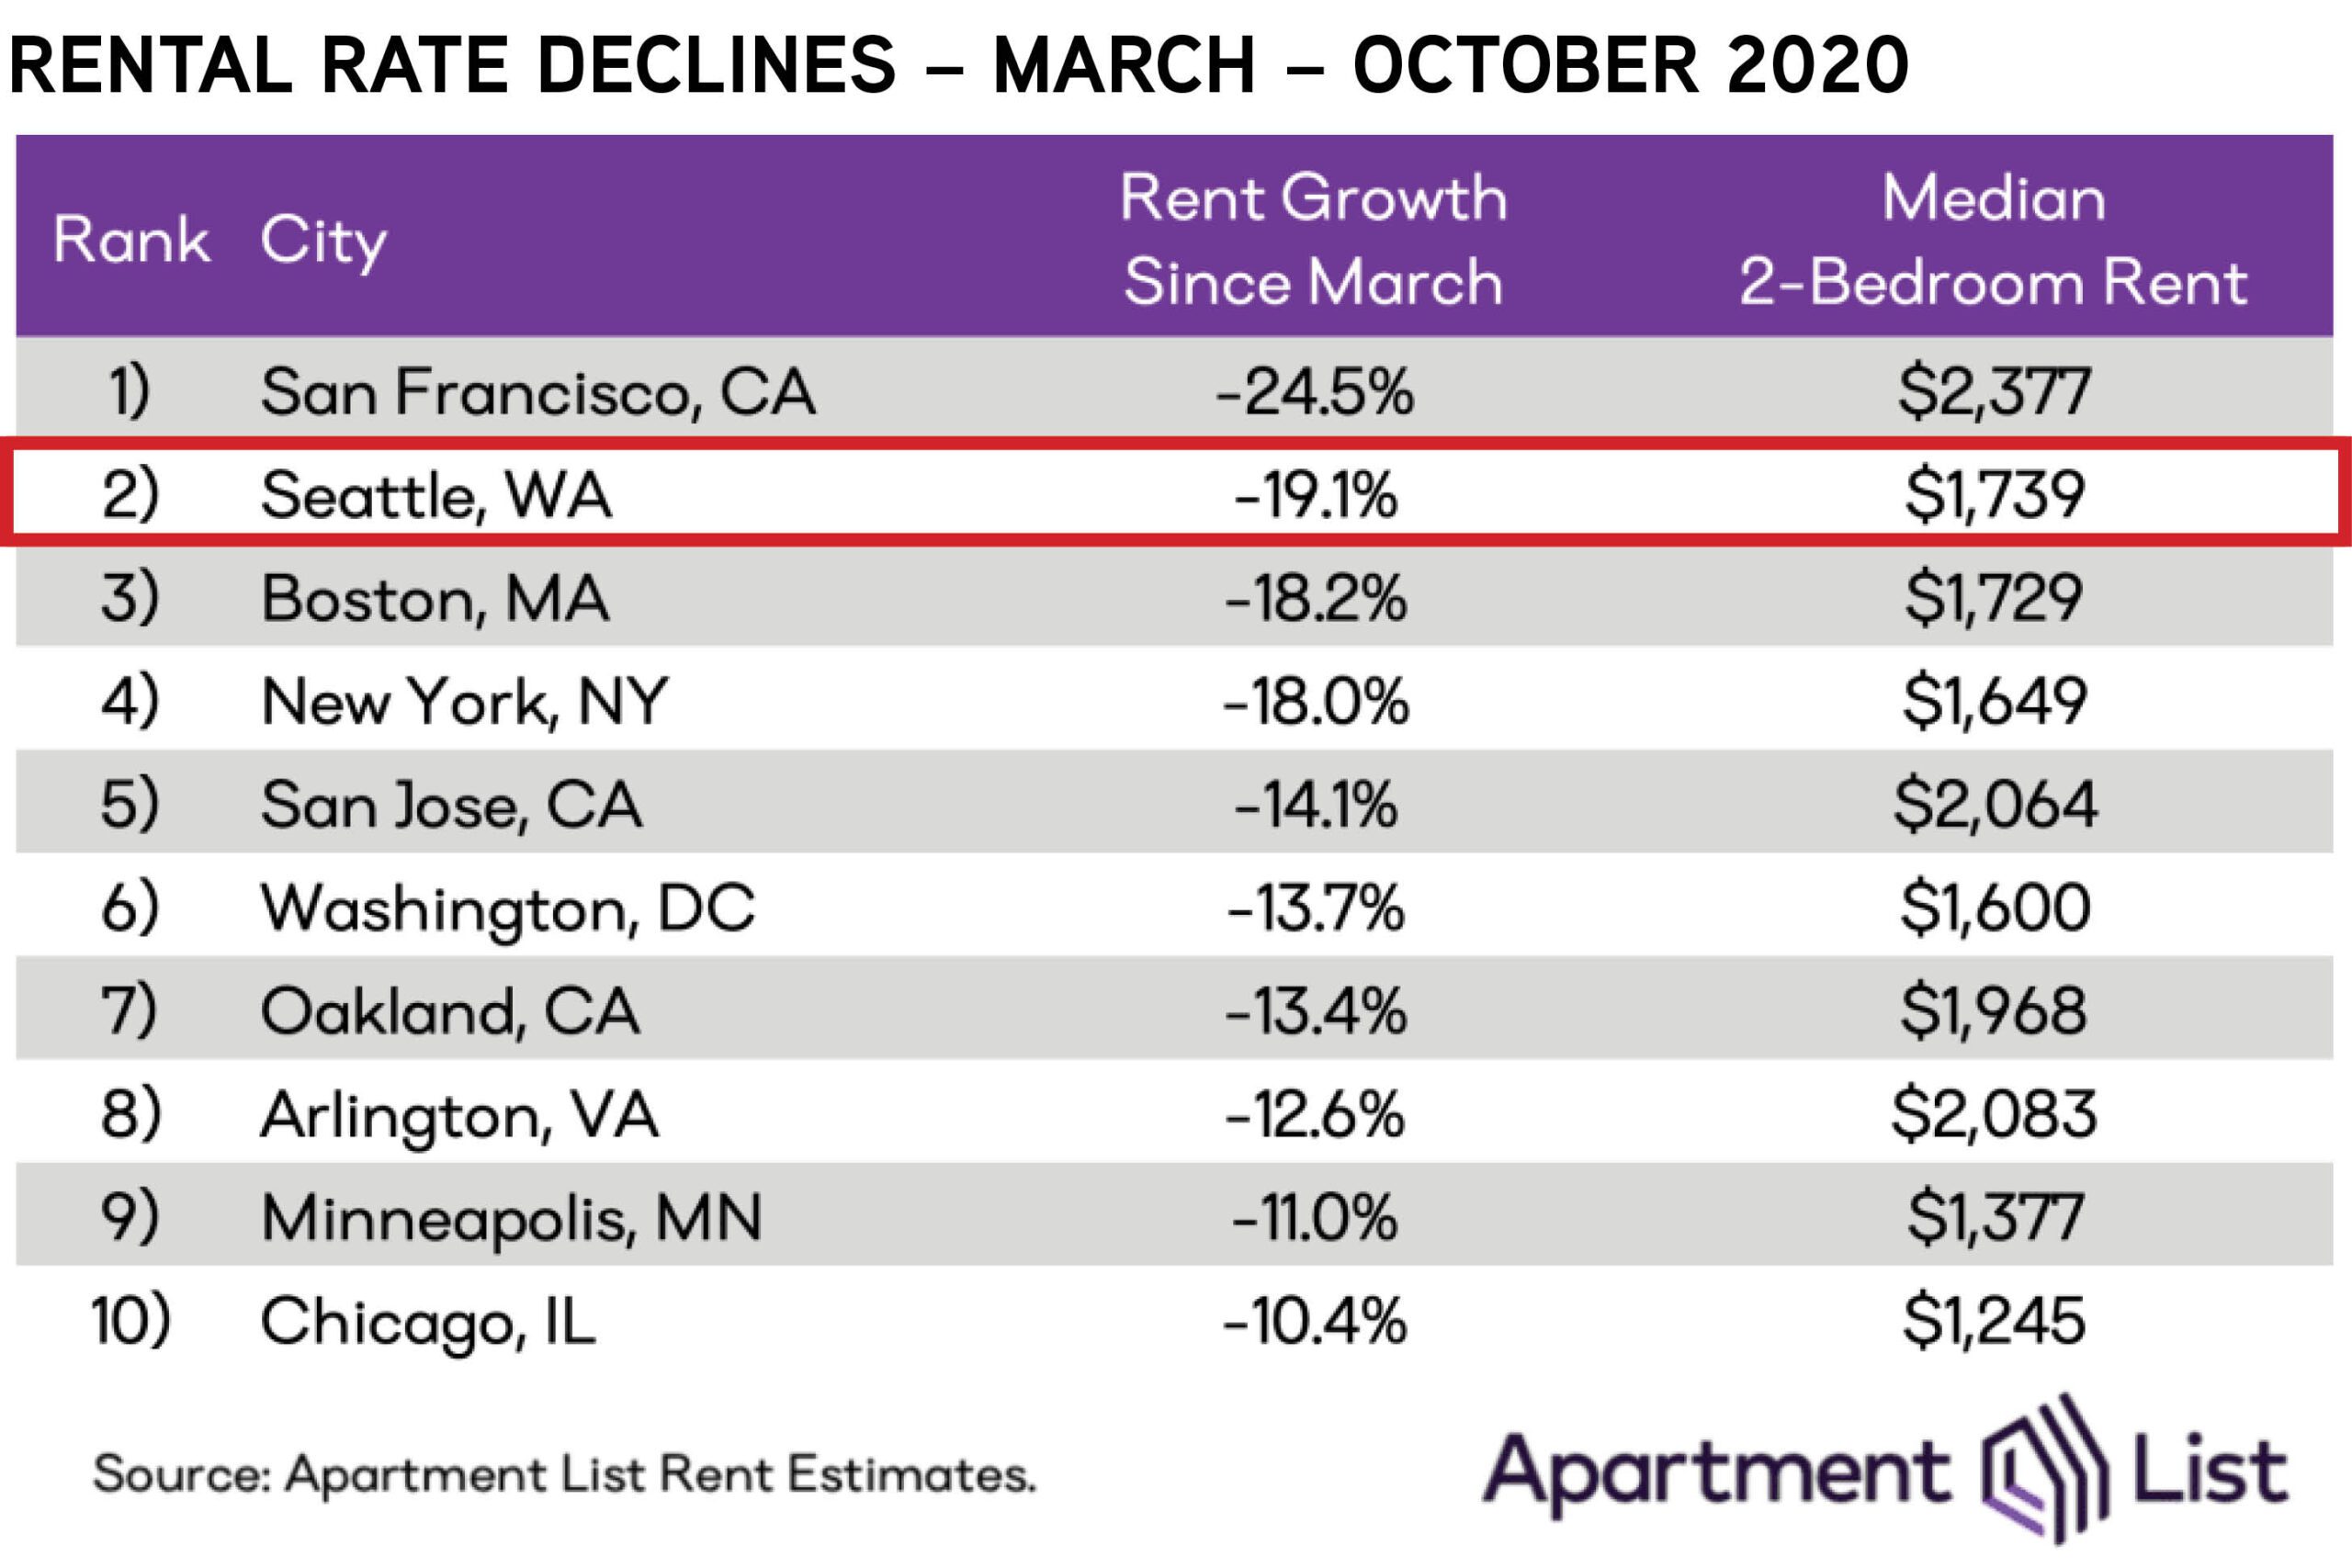
It seems that nearly every day a new report proclaims the depths of rental rate declines. While the dire picture these reports paint is real in some markets (certainly not all), this data is a mere point in time during a 100-year epidemiologic event. Shouldn’t we look more broadly?
What is “truth” with rental rate declines?
I’ll posit that we don’t yet know.
Between rising vacancy and increased concessions, its hard to ascertain what I consider “true” rent – defined by achievable rental rates while maintaining 95% occupancy, with no concessions.
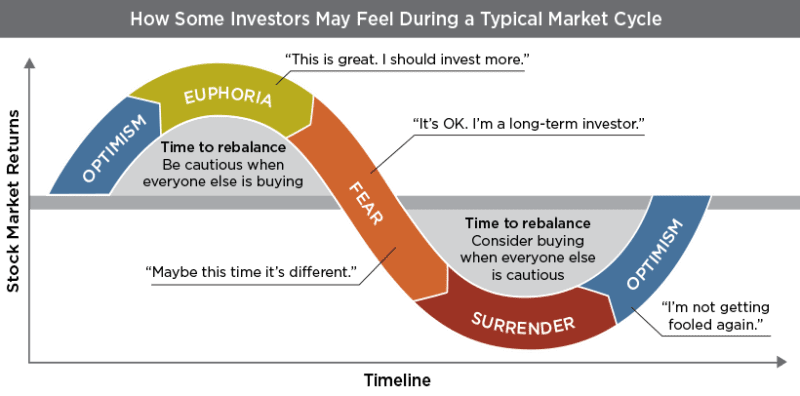
What we’ve learned from previous market declines is that declining rental rates cause investor panic.
What happens next? History is a good predictor.
In every single cycle, rental rates reset and begin a new upward trajectory – quickly achieving the previous market peak, then setting a new peak.
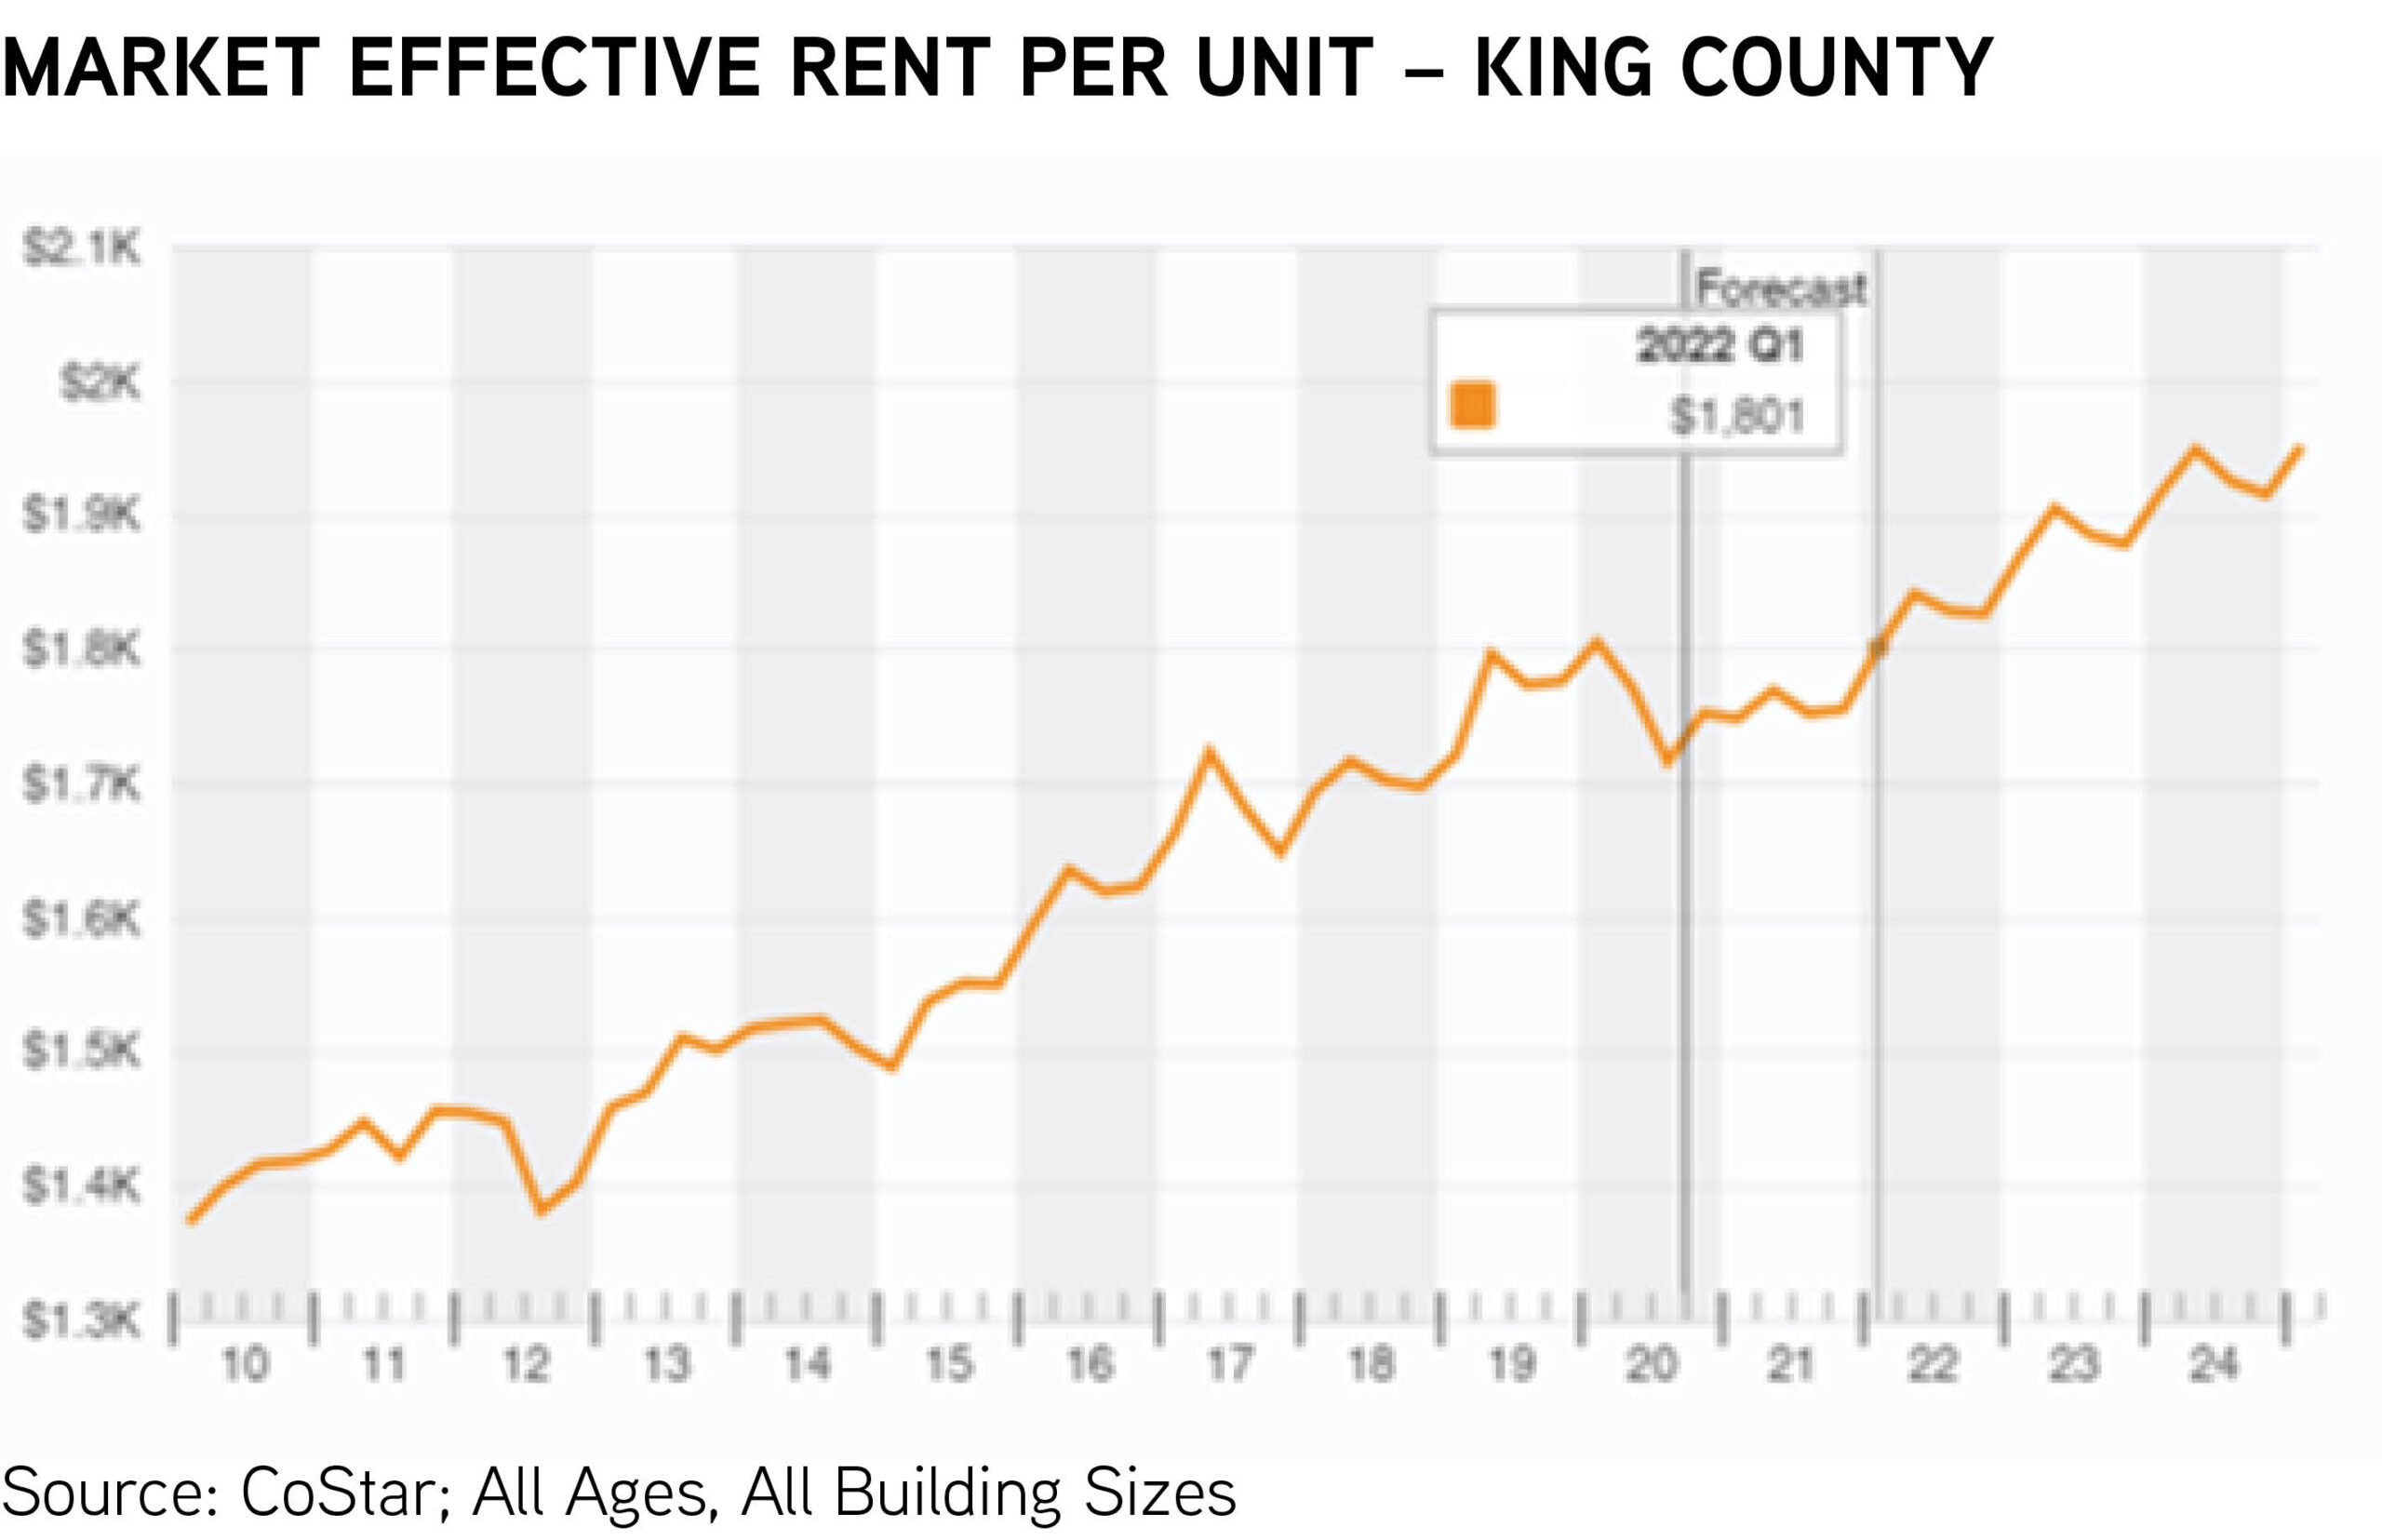
CoStar predicts that King County effective rent-per-unit will return to its previous peak by Q1 2022 – less than 16 months from now. Even if they are wrong by a 50% margin, fallen rental rates will be restored within two years from now.
This pattern of hitting, then exceeding the previous market peak is demonstrated cycle-after-cycle. Many are predicting no rent growth for several years, followed by slow rent growth for a few years. By that math one is ignoring 50-100 years of market trends in favor of guessing what will happen in 5 years based on the last 10 months.
My bet is that this cycle will be no different than last – and the one before it.
Lesson 2 – Control What you Can, Namely Expenses
Unlike rental rates, the topic of expenses is not sexy enough to make headlines. However, in times like these, gains made by controlling expenses are much more predictable (and controllable) than maintaining rental rates.
The largest culprits in expense growth are taxes, insurance, and payroll. While taxes are inevitable, we are seeing nearly every assessment outpace valuations.
What does this mean?
It’s time to fight City Hall (or at least your friendly local assessment authority). In many cases, tax assessments may be spot-on, yet for many properties tax assessments continued to escalate while values declined – demonstrating over-assessment.
The COVID-19 pandemic also disproportionately impacted insurance rates. For those renewing old policies, and placing new policies, in 2020, there likely is not much relief. I expect that insurance companies will need to come back into the market to get more competitive next year – so be sure you are shopping carriers.
Finally, revisit vendor contracts and marketing costs. Now might be the time to have the tough but fair conversation to optimize the effectiveness of services versus contract pricing.
In a time where income is harder to come by, each cycle reminds us where we can find savings having the greatest impact on NOI.
Start early in cutting expenses – I assure you they will find a way of growing again as we quickly enter the next market expansion!
Lesson 3 – Good Deals are Done in Bad Times
It’s one of the first adages I heard when I entered the commercial real estate business several decades ago – and it has always stuck with me.
When times are good, the herd rushes into the market to do tomorrow’s deal on yesterday’s dynamics. At the time, such behavior is reinforced by social proof borne of other’s behavior. The “great” deal your friend just inked, headlines, and the ease of getting deals done. A lot of people saying “yes” – capital partners, lenders, appraisers – convinces us that times are good – deals must be good.
But what deals are to be done in “bad times”?
Previous cycles inform us that some of the best deals are done when it feels harder for them to make sense.
How often have your heard – “I should have bought back in [blank] year”?
That [blank] year probably ended in a 1 – 3. Likely 1991, 2001, 2011.
The reason for the phenomenon is that in the early times of a market correction pricing is based on the previous cycle peak, while hindsight is then based off the following market peak.
Previous market cycles teach us the lesson to look forward, not backwards, in the dark days of bad times.

Lesson 4 – Entitled Development Sites Vault Back
Buy land, they are not making more of it!
Very true, yet it turns out that the timing of when you buy that land – and when you try to sell that land – is very, very important.
Land has been around for a long time, but as recent as 2011 is was quite hard to sell it – especially if it was priced with a permit to build an apartment development.
At that time, prescient developers were picking up well-located, permitted development sites very close to – or in some cases – below the raw, unentitled value of the land.
Not more than a year or two later, late-to-market developers were scrambling to find, and rushing to pay a premium for, entitled development site in order to take advantage of the rising demand dynamics.
As it turns-out, market corrections occur much faster than permitting timelines. In fact, I’ve noticed market downturns shortening while permitting timelines have only expanded.
The lesson previous cycles teach us is that the time in which permitted land values decline are short – and possibly shortening.
Lesson 5 – Expansions Emerge in Hindsight
Hindsight is 20-20, as we’ve always been told. This is not a play on the calendar year, but just a fact of what I call the “snow globe” concept – when you are in the snow globe, it’s hard to tell that you are in-fact, in the snow globe.
Because numeric values are relative, we only notice big changes when there are enough data points to prove it so – and those changing data points take time to recognize.
It generally takes 12 – 18 months to call a major inflection point in a financial market. The economic impacts of COVID-19 were much more immediate based on the nature of the pandemic – but in nearly all other market shifts, the peak-to-trough cycle took much longer.
Similarly, timing the bottom of a market to take advantage of the trough-to-peak curve is hard to do as we often don’t realize we’re out of the bottom until we have 12 – 18 months of data to prove it so.
Accordingly, a much safer methodology is to get out of the snow globe and study the patterns of history. And those patterns demonstrate rather short periods of market declines.

The above graphic shows 70 years of unemployment data. Shading represents increases in unemployment, which we can use as a proxy for market declines, and/or declining demand.
These short “shaded” periods are followed by rather abrupt changes toward market expansions, and/or increasing demand.
Previous cycles teach us that the duration of previous market decline-to-expansion are far better predictors of where the market is headed than reading today’s headlines – aka living in the snow globe!
Whether you own an apartment building or development land and want/need to sell, or you are looking to get into the Seattle/Puget Sound market–deals are still getting done.
We can help with a Free Valuation of Your Apartment Building or answering questions about lending for both new acquisitions and refinances (contact Alex Mundy).
Working with a capable, experienced, and active team of sales and lending experts is always important–and such sage guidance was never more necessary than it is today.
Give us a call to Turn Our Expertise into Your Profit!