


With investing, the key to success is making the correct ‘bet’ – or as we call it, ‘investment’ – on a future event. In the apartment industry, that event upon which we bet may be renter demand, evidenced by rental-rate growth, or investor demand, evidenced by strong pricing. Such bets – or investments – are much easier, and results much more predictable, in steady-state markets.
What should the prescient investor do in non-steady-state markets?
No, the answer is not panic.
And, possibly worse, no … not follow the crowd.
The need arises for in-depth analysis and conviction towards a thesis. Investment theses are important and challenging. Even more challenging, to the extent any thesis is unpopular is often a measure of its difficulty. And inverse to popularity is often accuracy.
More clearly stated, I believe that in uncertain times unpopular decisions are proven more accurate in the long term.
Times are not completely uncertain in Seattle in 2019, yet it’s clear that the current economic expansion cycle is matured, and the balance of supply and demand is in question.
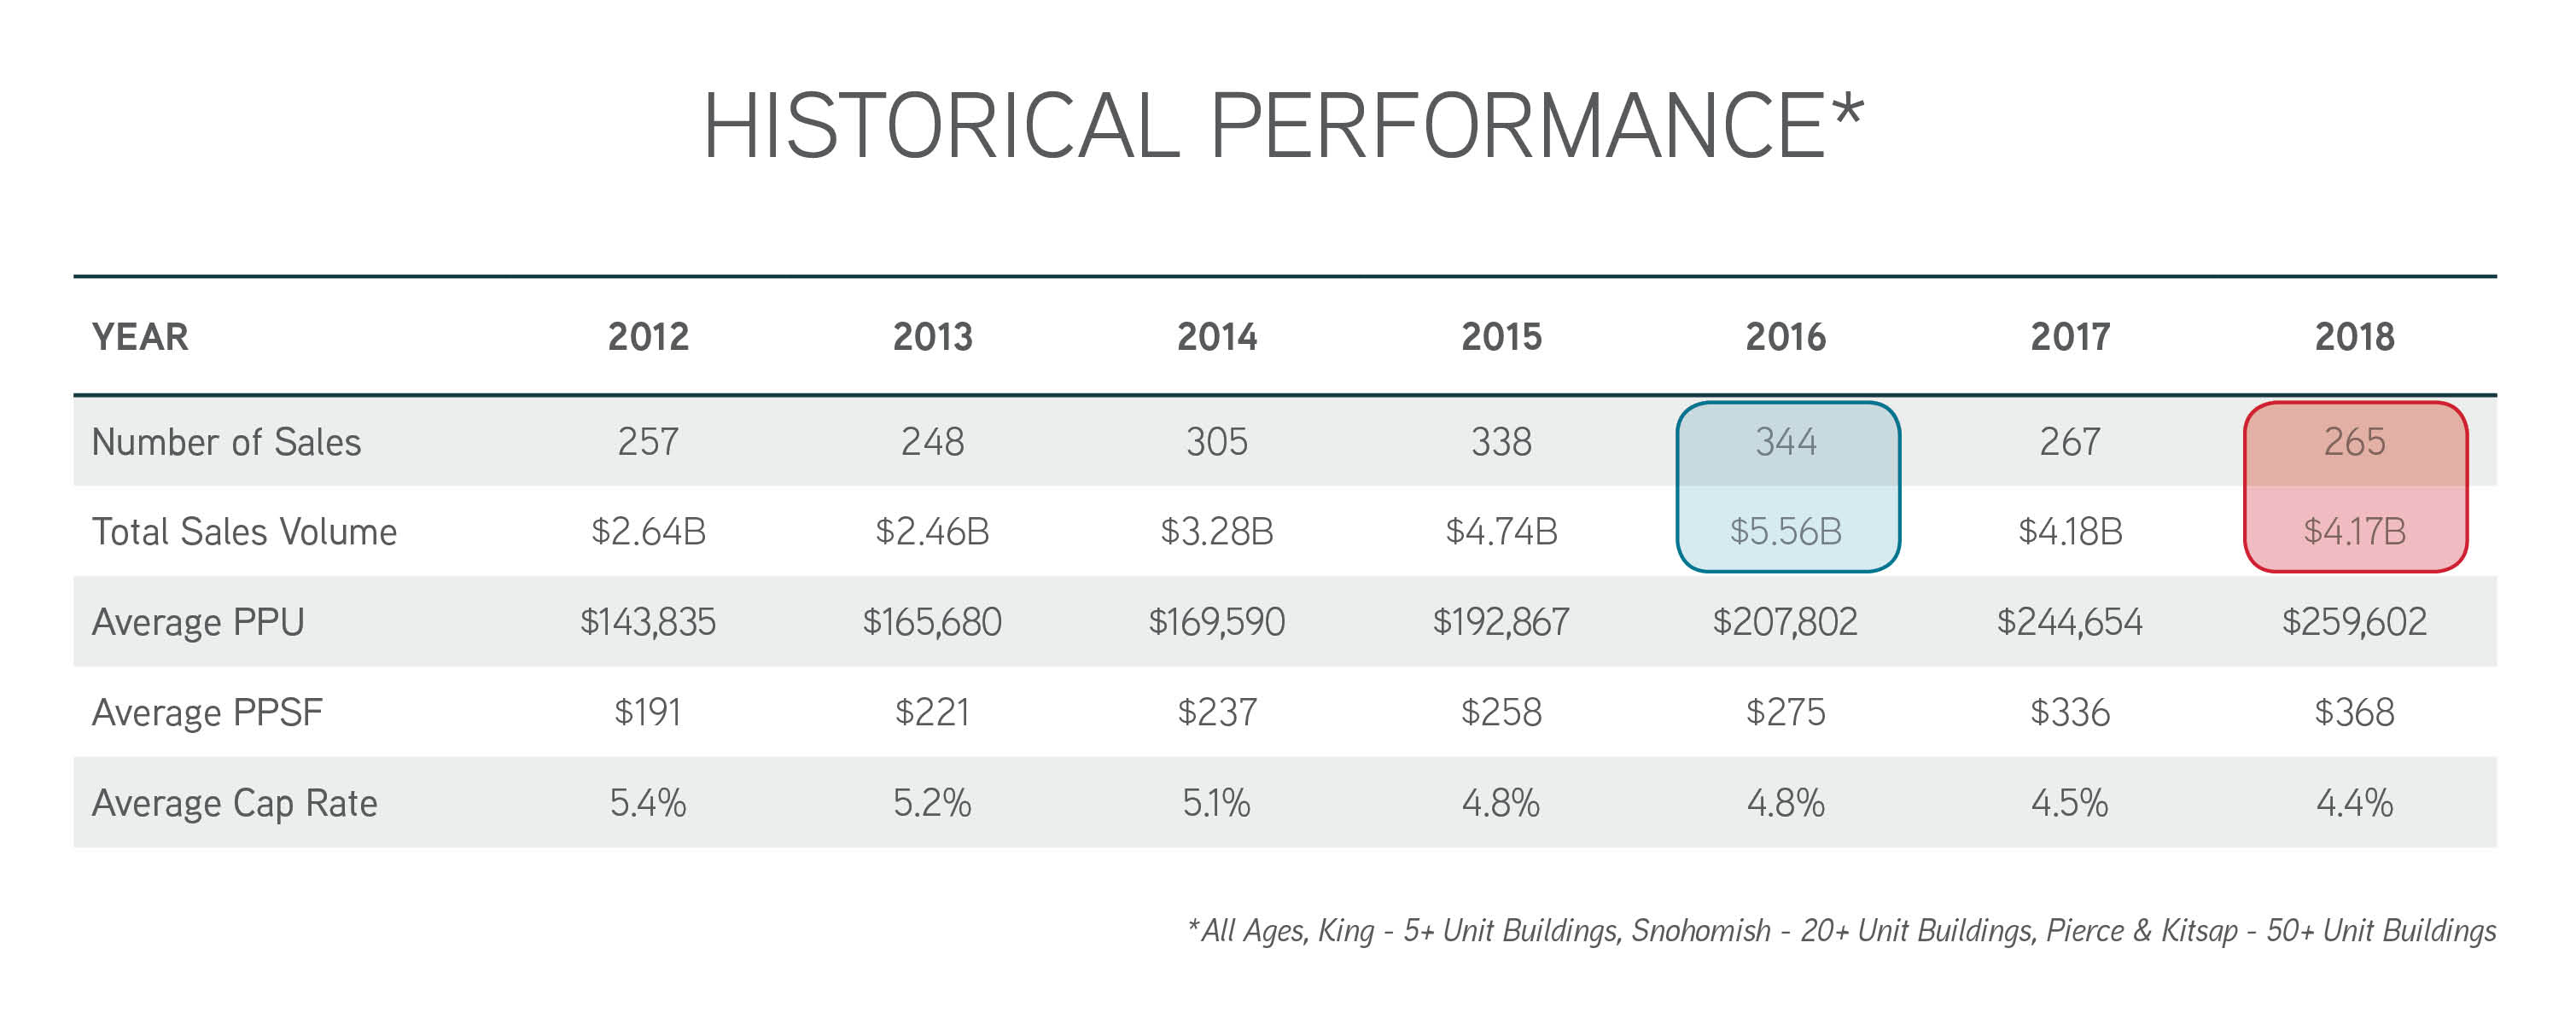
Last week, we published our 2019 Apartment Market Study: Sales Analysis, detailing 265 apartment sale transactions in 2018 and analyzing 15 years of apartment sales across King, Snohomish, Pierce, and Kitsap Counties.
In this market study, we glean insights on:
- Sales Trends in 2018
- Historical Sales Trends
- Predictions for Future Sales Activity
Applying these trends to market cycle analysis leads to several conclusions of what 2019 holds for apartment market sales.
Sales Trends & Cycle Analysis
Measuring transaction volume in both number of buildings sold and dollar volume, 2016 far surpassed 2018, slowing by nearly 25%. Pricing continued to rise, yet capitalization rates remained nearly flat (compressing by 10 BP). Given that the overall market experienced rental-rate growth in 2018, this analysis proves that on a relative basis sales activity and pricing slowed on all fronts.
Of course, not every sale followed the same pattern. Building size, age, location, and operational differences each lead to individual results. A deeper review of the market study will assist in a more granular analysis, yet focusing on overall market averages is important and telling.
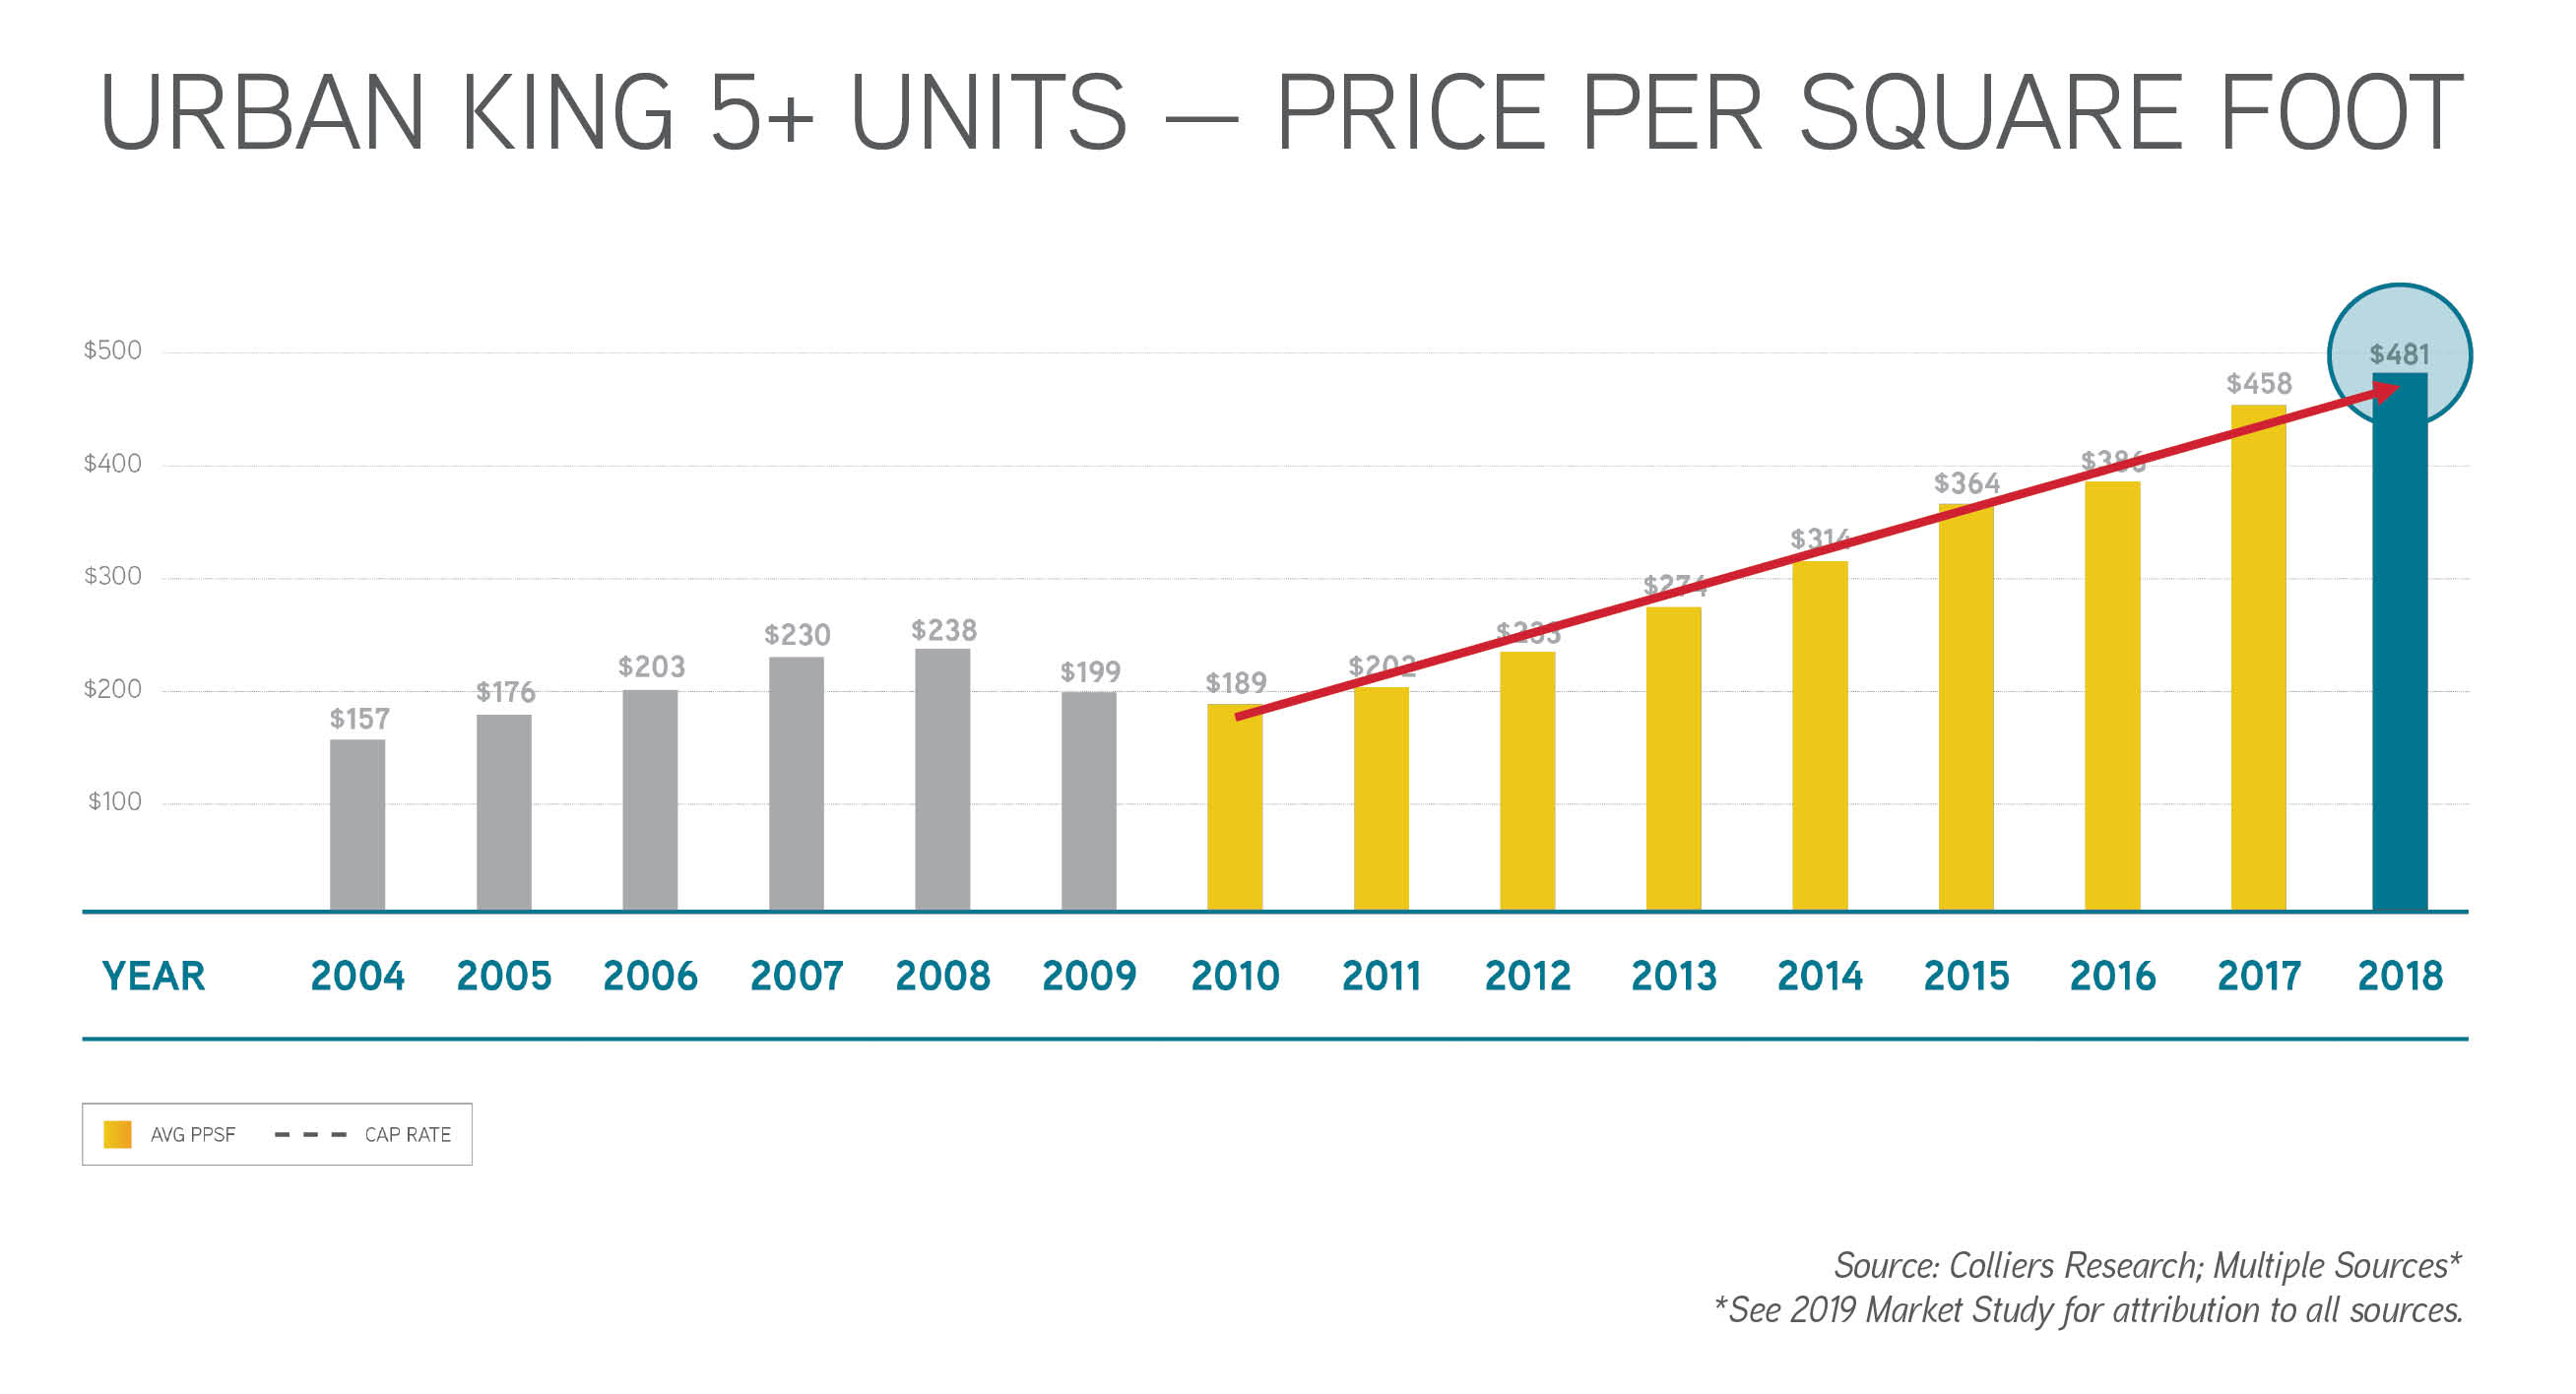
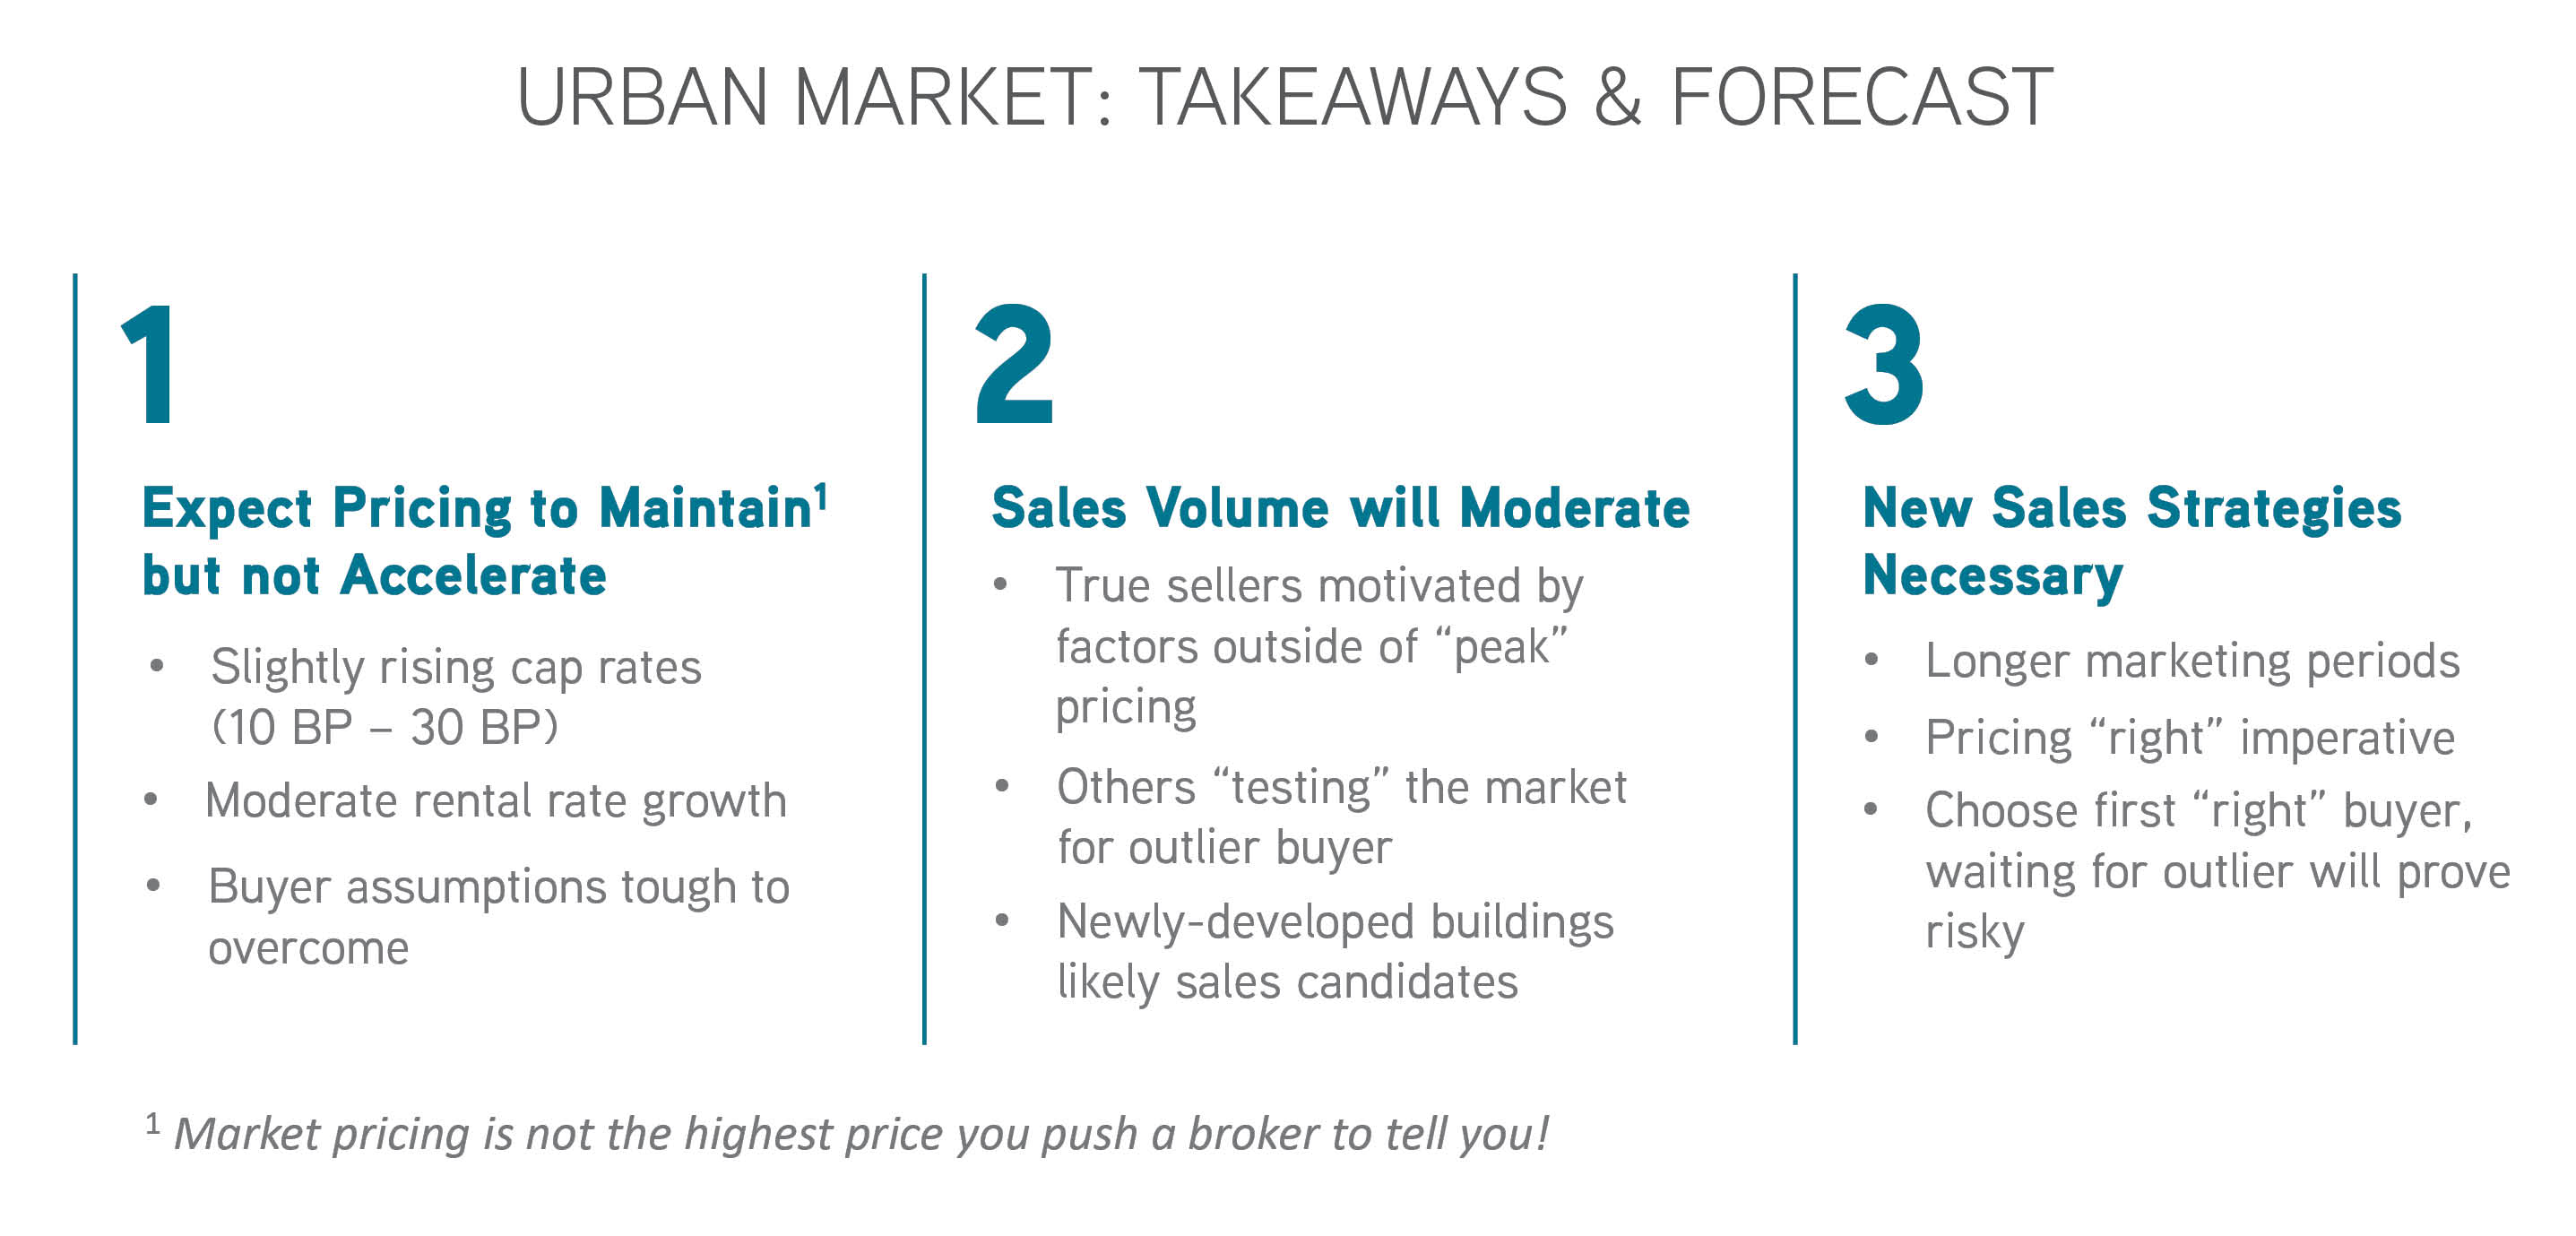
Urban Markets – Sales Trends
In urban markets, sales pricing (measured on a basis of price per square foot), continued to escalate in 2018. However, pricing growth from 2017 – 2018 of 5% pales in comparison to the nearly 19% growth experienced from 2016 -2017 (keep in mind that sales of new buildings skews both numbers).
Turning to capitalization rates, which is a strong measure of investor demand, rates have remained largely flat for the last 4 years.

Urban Markets – Cycle Analysis
Further analyzing sales pricing overlaid with capitalization rates, and taking a long-term perspective, leads to some interesting conclusions. Conclusions that are well-applied to predictions on how the market will continue to perform.
First, the last peak in transaction volume – buildings sold and dollar volume – occurred in 2005. Given the peak in this cycle was very likely 2016, this strongly suggests a typical 10-year cycle. Our current analysis does not measure the 20-years prior, yet I’d hazard to guess the mid-1980s and mid-1990s looked much the same.
Second, during the last economic cycle the trough in capitalization rates – demonstrating maximum compression (demand) – occurred in 2007. Although we don’t yet have enough data to measure past 2017, the data we do have suggests 2017 may replicate 2007 as a market-cycle low in capitalization rates.
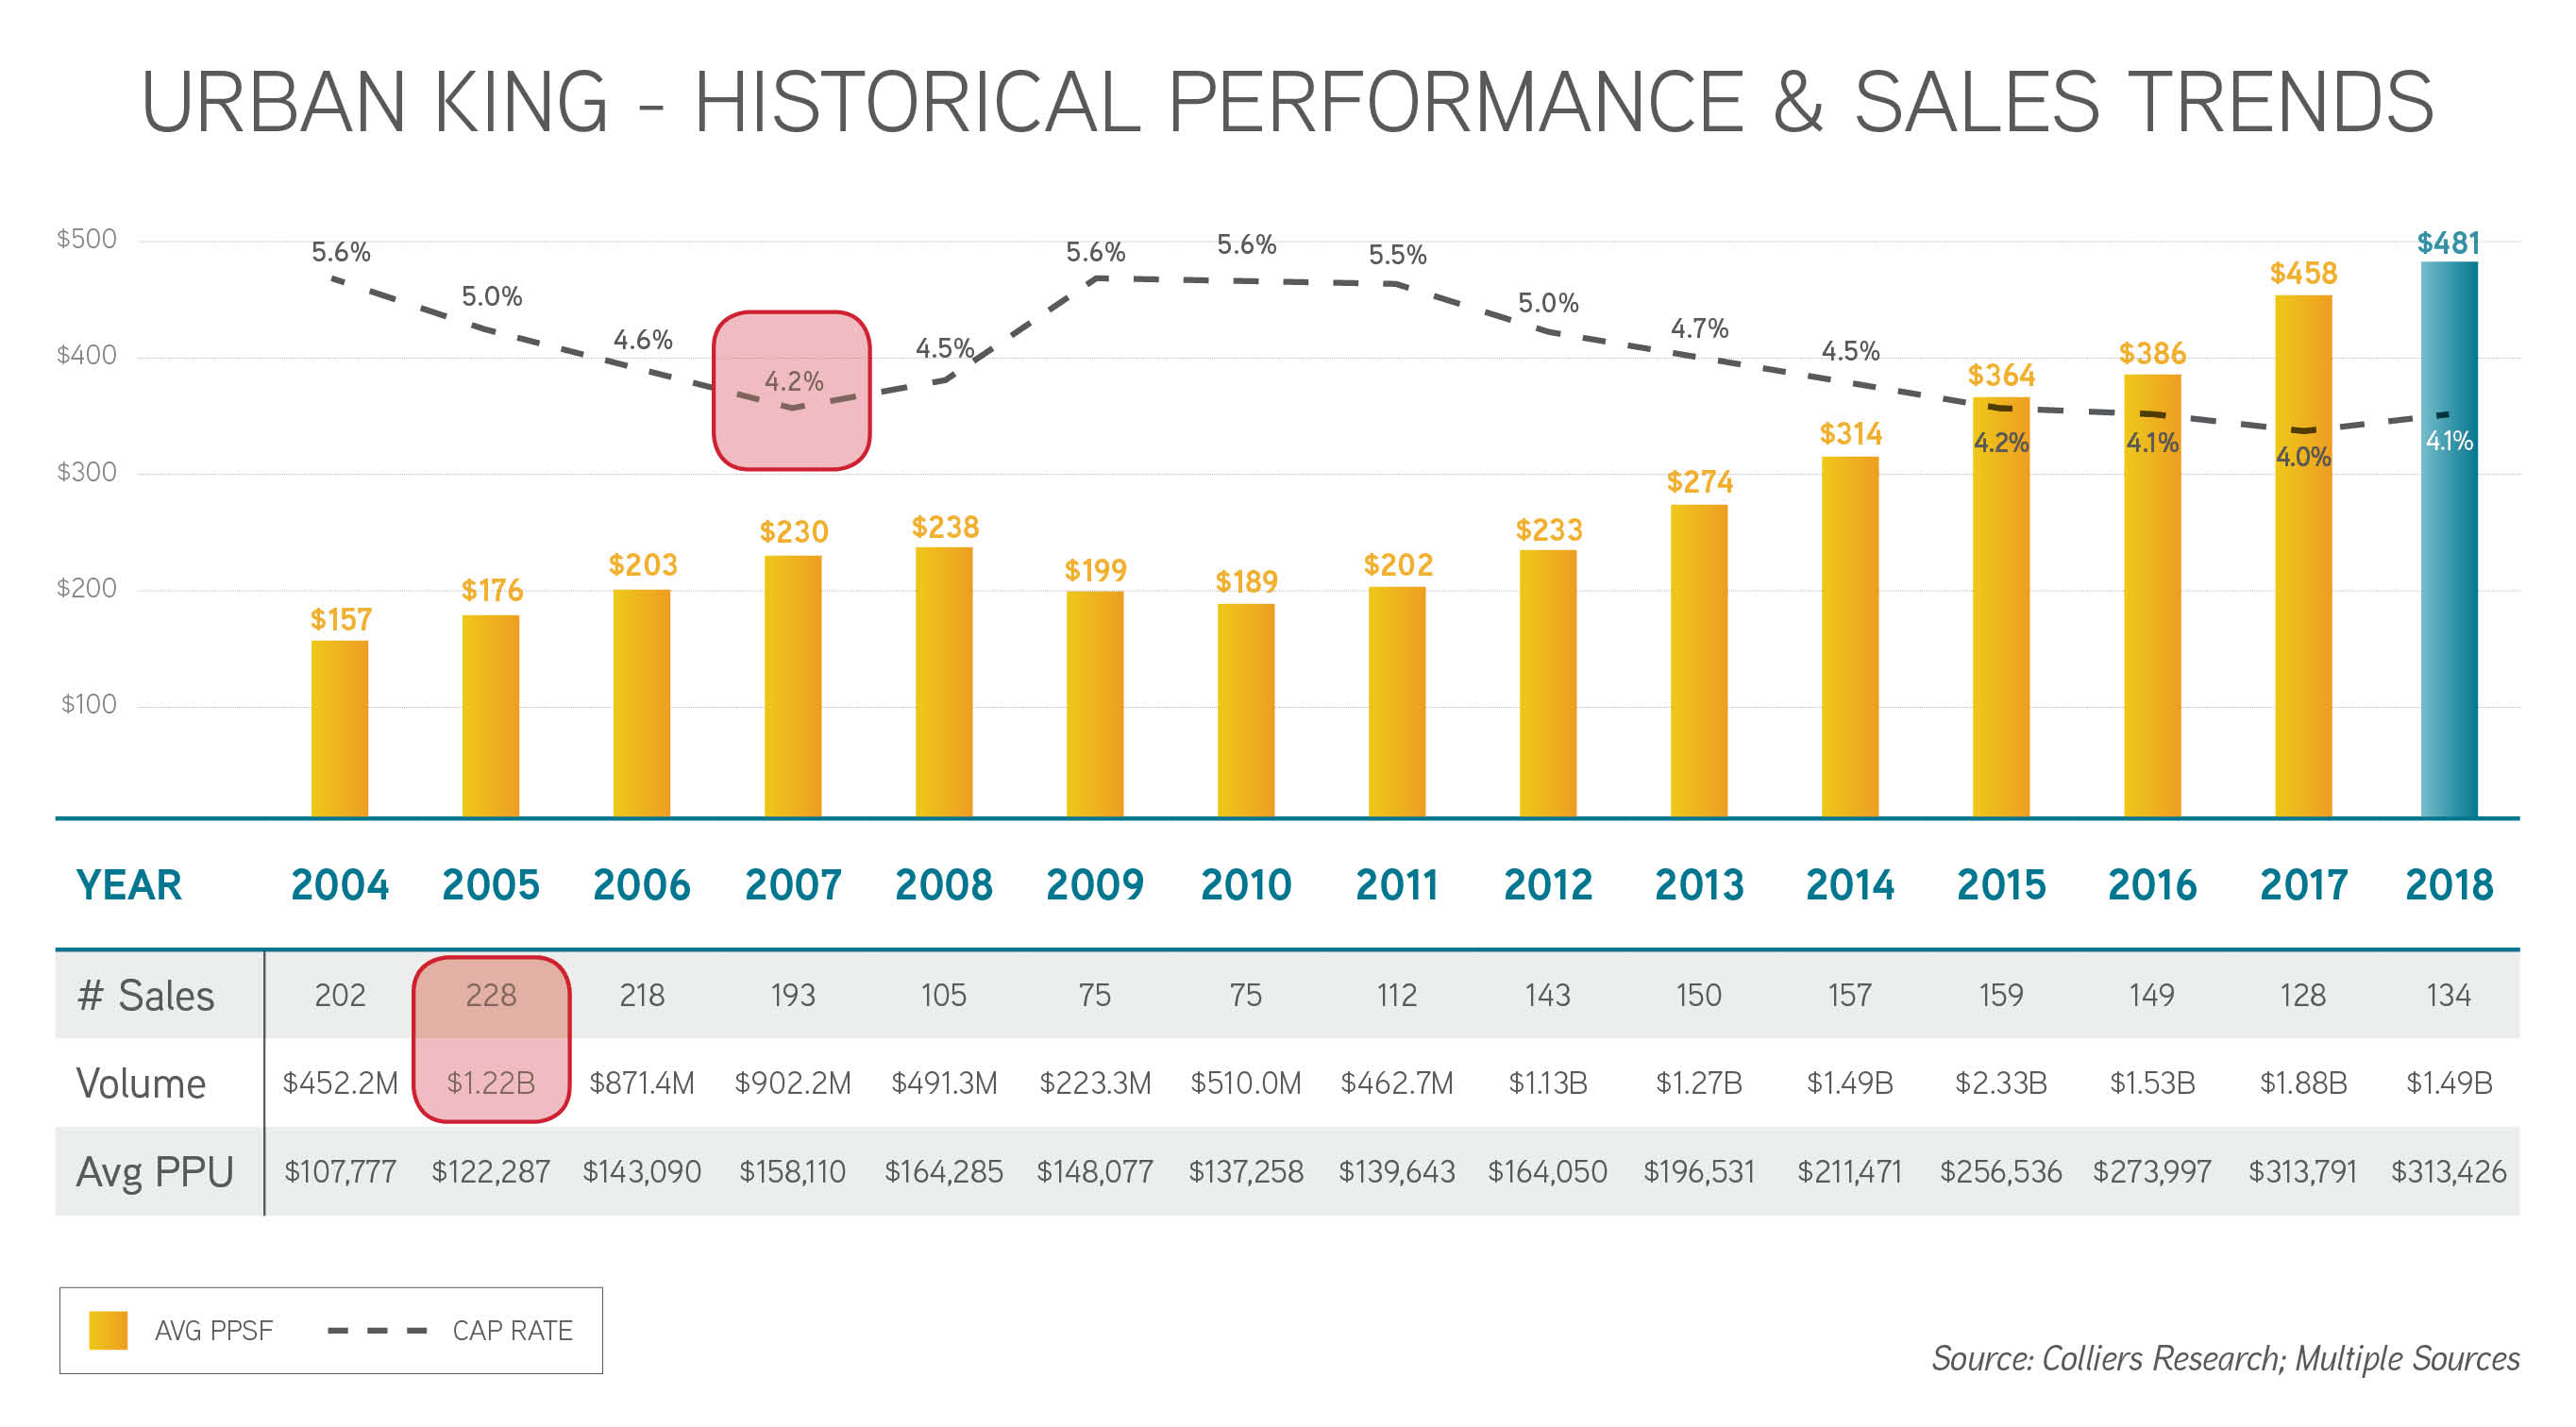
Finally, sales data from 2005 to 2009 suggests that the “perfect” year to sell may have been 2007 (highest pricing relative to lowest cap rate). Although 2008 exhibited higher sales pricing, the rise in capitalization rates may have eroded value. Looking one year further to 2009 – well, hopefully we all remember that lesson!
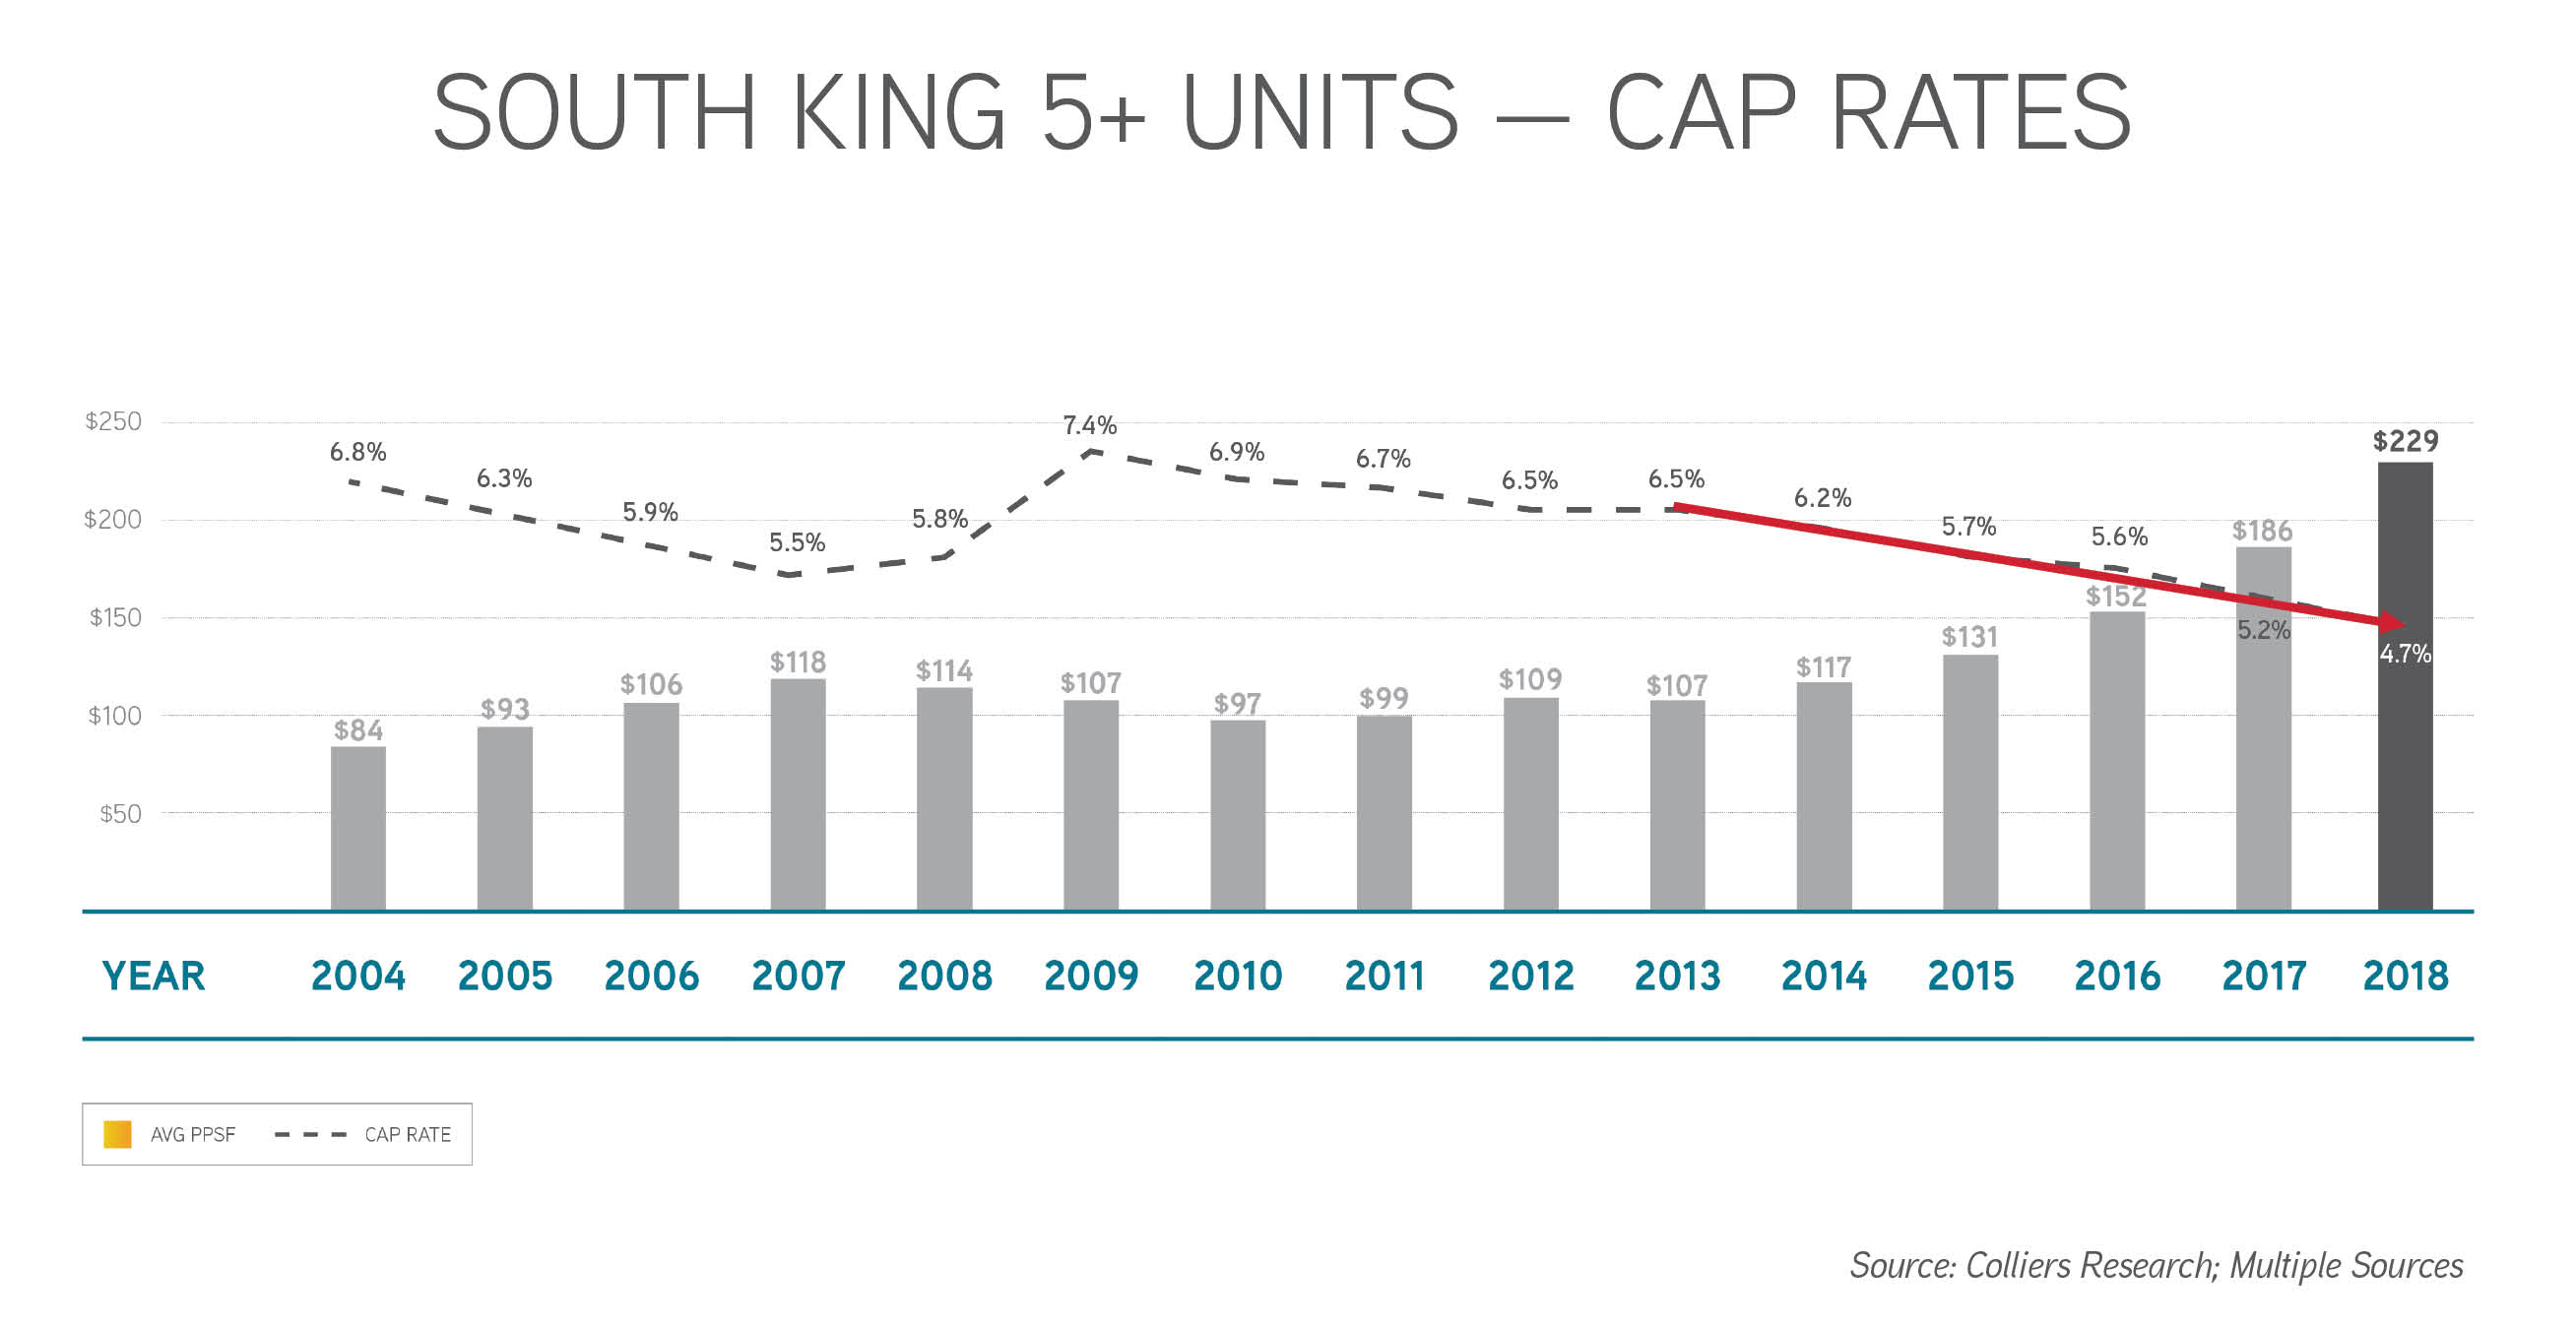
Suburban Markets – Sales Trends
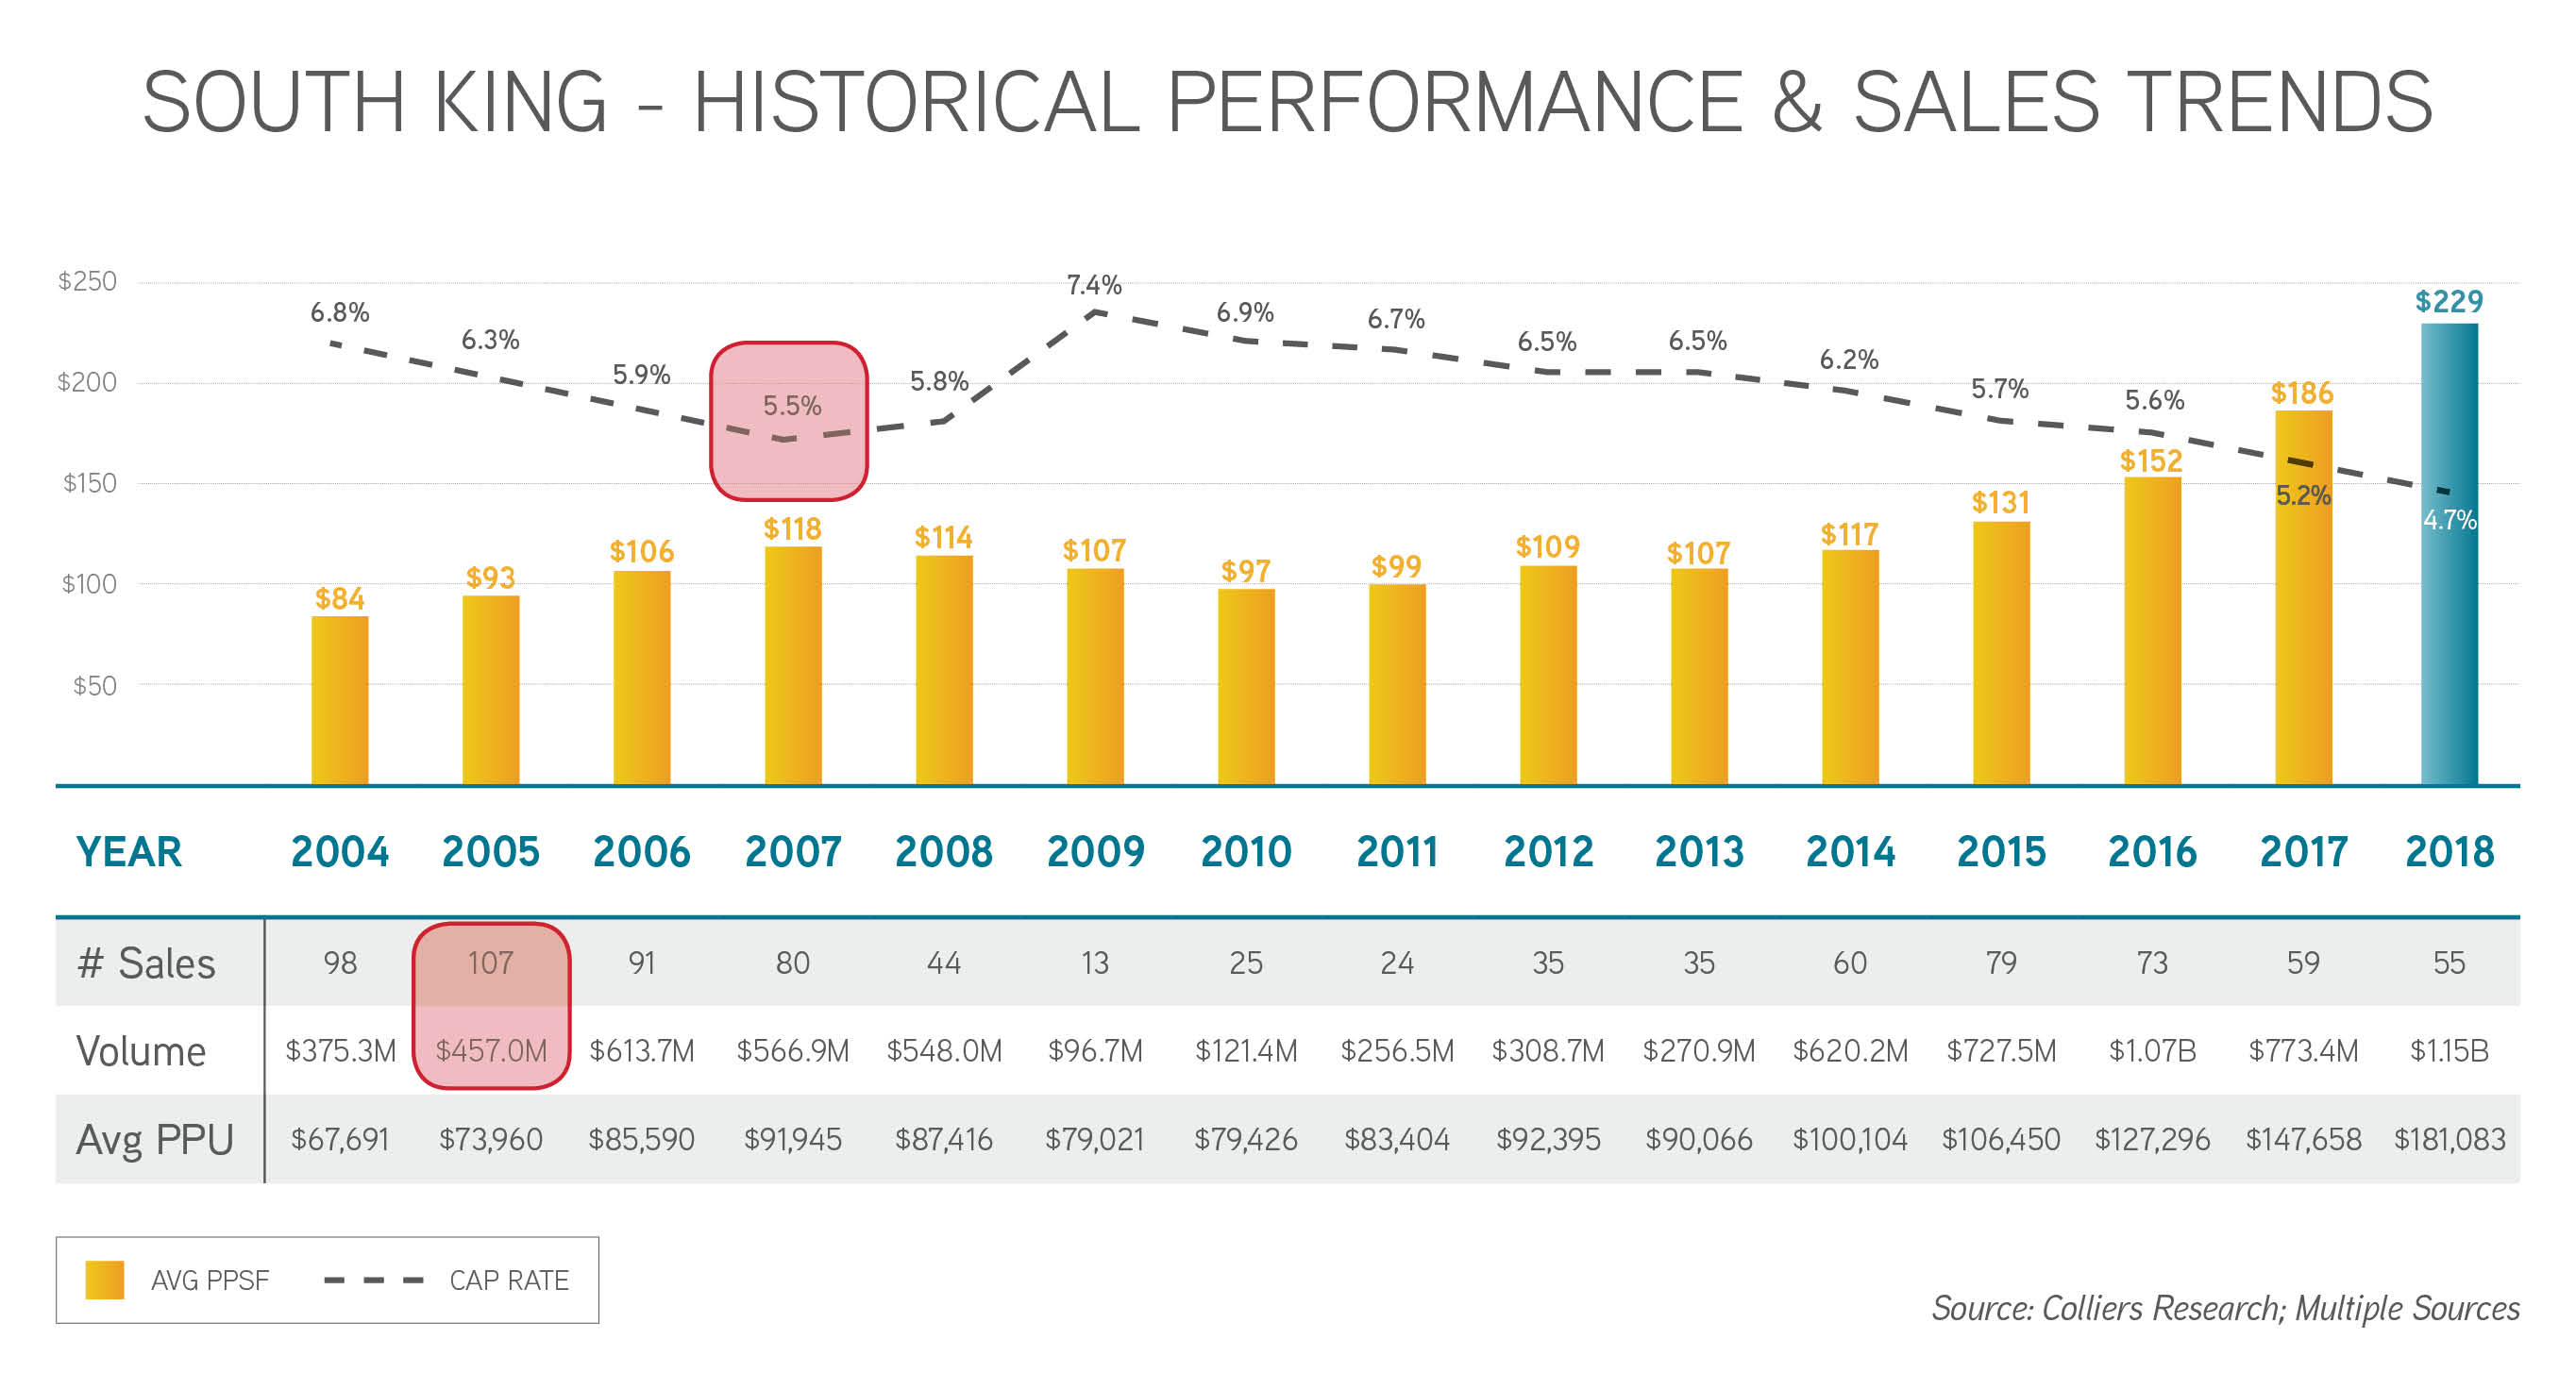
In our region there are far more suburban markets than there are urban markets. Accordingly, we often use South King (Renton/Des Moines/Kent/Federal Way) as a proxy.
Although these markets took much longer in this market cycle to see a run-up in values, it happened quickly. The data shows very strong appreciation in recent years, with little slow-down in 2018 – nearly identical value growth year over year for the last two years.

Interestingly, despite the duration of the current market expansion, capitalization rates continue to compress in South King.
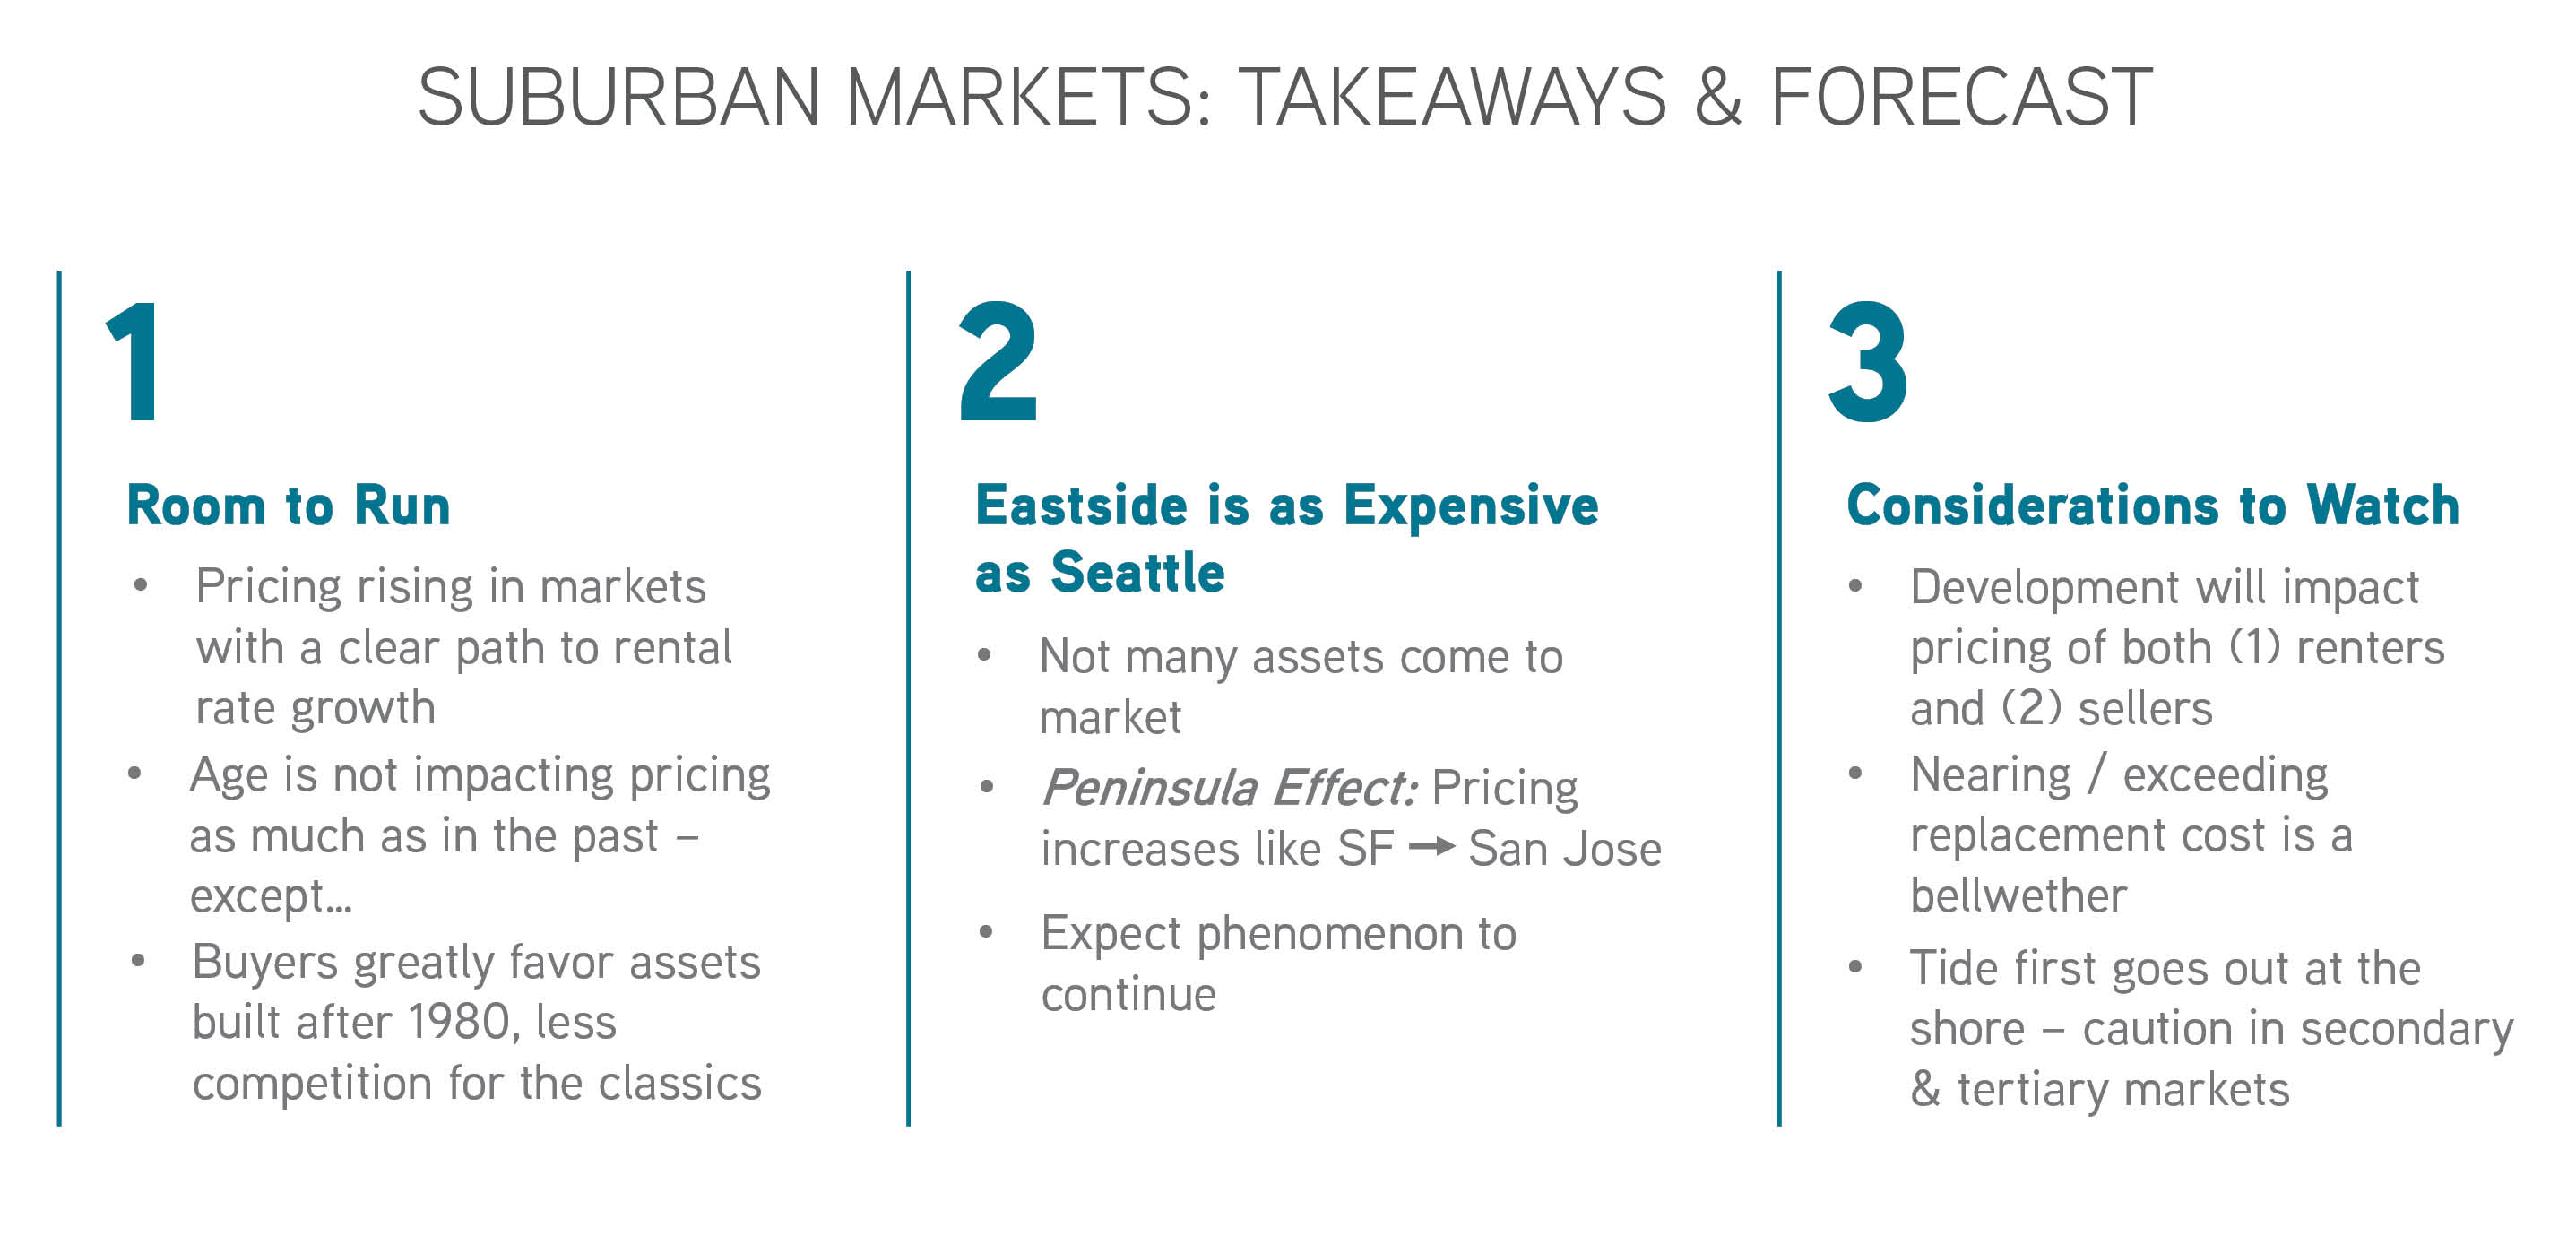
Suburban Markets – Cycle Analysis
Turning back to cycle analysis, we see nearly identical timing/value trends to that of Urban King during 2005 – 2009. However, these trends are not carrying forward to the current market cycle.
Why is this time different?
Most notably, three factors are influencing accelerating pricing and compressing capitalization rates (and they are inextricably intertwined):
- Renter ability/willingness to pay higher rental rates
- Investor confidence in future rental-rate growth
- Scant development pipeline, ensuring that renter demand outstrips supply
Are all three factors in play in all suburban markets? Certainly not.
To better understand dynamics in each Puget Sound submarket, download and read our 2019 Apartment Market Study: Sales Analysis.
Based on this analysis, we can make educated predictions for what we expect in 2019.
Predictions for 2019
The following summaries recap our predictions for sales in 2019 – and likely beyond!
Whether you are considering selling your apartment building, buying more apartment buildings, or simply trying to optimize the portfolio of apartments you currently own, we can help. Call us for a valuation and to discuss how we can work together.
Allow us to Turn Our Expertise into Your Profit!