


As we enter each year, we never know how sales pricing or volume will stack up to previous years. Just twelve months ago, investors watched patiently as Inauguration 2017 was held on January 20. Then we waited…and waited…and waited. And when it came to apartment sales, not much happened. For months.
It wasn’t until around June 2017 that the market caught is breath, yet it was already too far behind the curve. By the time everyone was toasting the New Year, tri-county sales volume was down 25% year-over-year. Nearly 100 less deals traded, accounting for 10,500 units.
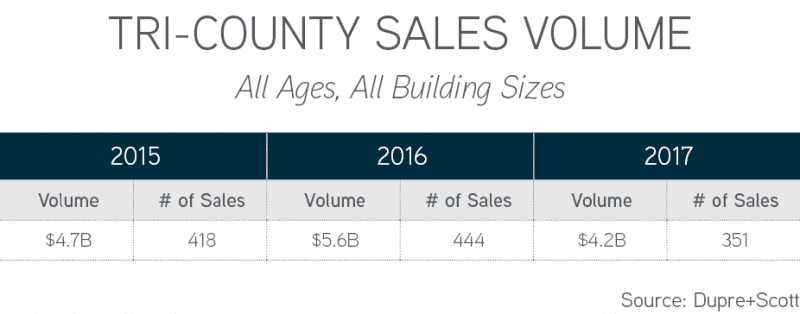
Comparing 2017 to 2016 provides for tough competition, as 2016 had the highest sales volume ever posted for the Puget Sound region. Yet, 2017 sales were still off from 2015 sales by nearly 12%.
Did we pass the market peak? Did it pass more than a year ago?
Measuring apartment sales in 2017 against previous years is a terrific benchmark for the market. Yet, much is lost in simply measuring transaction volume.
We are great evangelists of data and analysis, yet our number one rule is to “get granular.” To that end, this post analyzes multiple investment metrics across distilled market segments.
Principally, the following are discussed:
- Core-Located Class A Apartment Sales
- Core-Located Vintage Apartment Sales
- Suburban Value-Add Apartment Sales
1. Core-Located Class A Apartment Sales
Since 2012, apartment developers delivered more than 29,000 new apartment units in core-located neighborhoods in Seattle, and a large number of these new buildings sold upon stabilization. In the first part of the decade, not many new buildings were taken to market, yet from 2012 forward the trend of selling newly-completed buildings emerged.
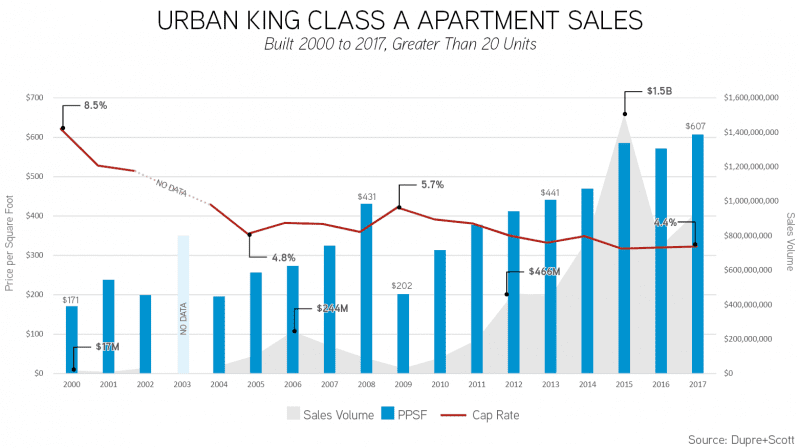
There is no question that 2015 marked the peak in sales volume of core-located, Class A apartment buildings. The market crested at $1.5B in sales, with 2016 and 2017 lagging significantly in sales volume. However, when it comes to value-based sales metrics, it’s clear the market hasn’t slowed!
Price per square foot (PPSF) continues to escalate almost each and every year, with capitalization rates settling in the 4.3% to 4.4% range since 2015. Although average price per unit (PPU) and average rental rates are down in 2016 – 2017 from a peak in 2015, this is simply the phenomenon of ever decreasing average unit sizes.
2. Core-Located Vintage Apartment Sales
If there is a segment of the market that has not received the press it deserves, it’s the market for core-located vintage apartment buildings. Although Seattle apartment investors “in the know” are well-acquainted with the value of these buildings, they don’t make headlines quite like 40-story, sexy, glass towers.
Given that these buildings have a much lower cost basis (compared to brand-new buildings), price appreciation in this asset segment is the greatest across the market. Average pricing in the year 2000 was $129 NRSF, which appreciated to an average of $376 NRSF by 2017. Capitalization rates during the last market peak in 2007 compressed to 4.1%, and a decade later in 2017 they hit an all-time low of 3.9%.
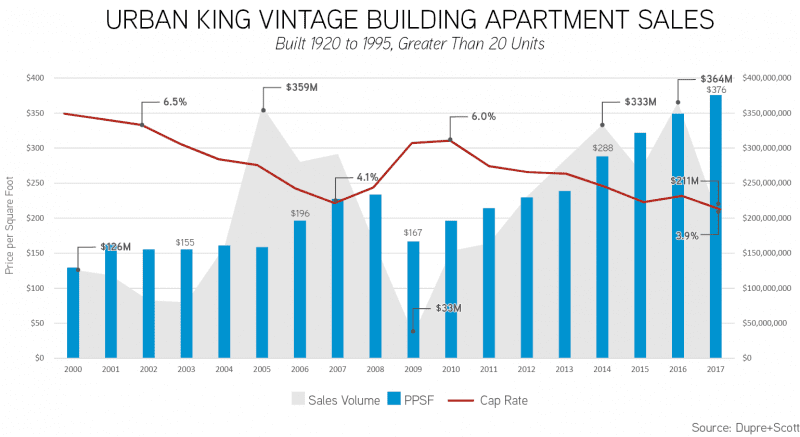
Interestingly, over the last 17 years, the peak sales volume was achieved in 2016, yet that volume is only off by 1.4% from a peak in 2005—proving that certain investors have understood the value of core-located vintage apartment buildings for some time!
3. Suburban Value-Add Apartment Sales
The current apartment development boom is only rivaled by the period spanning 1985 to 1995, when more than 80,000 apartment units were built in the tri-county region. While over 75% of the buildings built between 2010 and 2017 are in urban locations, during the last boom that number was inverted, with over 75% of development occurring in the suburbs.
As a result, while investors and renters alike flee the urban core of Seattle in search of better pricing, they find themselves competing once again—yet now in the suburbs. The result on apartment pricing is both significant and demonstrable.
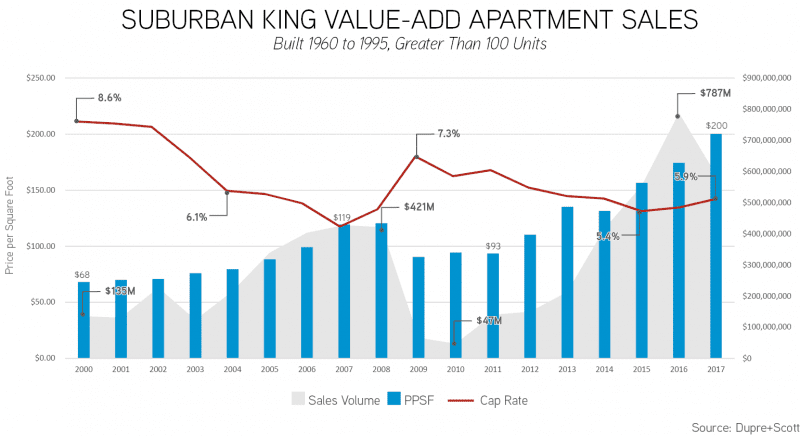
During the run-up of the last market cycle, pricing crested $120 PPSF in 2008, and capitalization rates dipped as low as 4.9% in 2007. Ten years later, although capitalization rates have not fallen below the mid-5% range, pricing surged to $200 PPSF.
Given that average rental rates in 2017 were $1,514/month, versus $906/month in 2008, it’s no surprise that investors are willing to buy into assets at a much higher basis. Furthermore, rapidly increasing replacement costs allay the general investor concern of purchase price versus replacement cost.
What Will 2018 Hold?
A quick look at sales trends across the market will only provide marginal insight. Generally speaking, sales volume in 2018 is likely to match or exceed that of 2017. In each market segment, 2017 demonstrated price appreciation over previous years, and that trend will continue—but may not accelerate across all markets. Obtaining outsized returns is simply not as easy as it once was!
Headwinds of a +50,000 unit development pipeline, increasing cost of capital (both debt and equity) and a maturing economic cycle are all omnipresent. Countervailing forces of a wonderfully strong Seattle / Puget Sound economic environment continue to buoy the CRE investment market.
Opportunities in this market—whether you are a buyer or a seller—are nuanced, and require a critical eye to identify and a deft team to execute.
Give us a call to discuss your plans and goals in 2018. Whether you are considering selling your apartment building, buying more apartment buildings, or simply trying to optimize the portfolio of apartments you currently own, we can help.
Call us for a valuation and to discuss how we can work together.
Allow us to Turn Our Expertise into Your Profit!