


We are on the eve of releasing our 2017 Seattle Market Studies and want to provide you with the very first look! Our market studies feature the latest sales metrics, development pipeline, and rent and vacancy data available, as well as expert insights from our team.
Early next week we will provide access to the following research reports:
50+ Unit Apartment Market ► 2017 Seattle Apartment Market Study
5 Unit – 50 Unit Apartment Market ► 2017 Seattle Neighborhood Apartment Market Study
Stay tuned and in the interim, take a look below at some of the most prominent trends we discovered.
Five Biggest Trends in Seattle’s Market
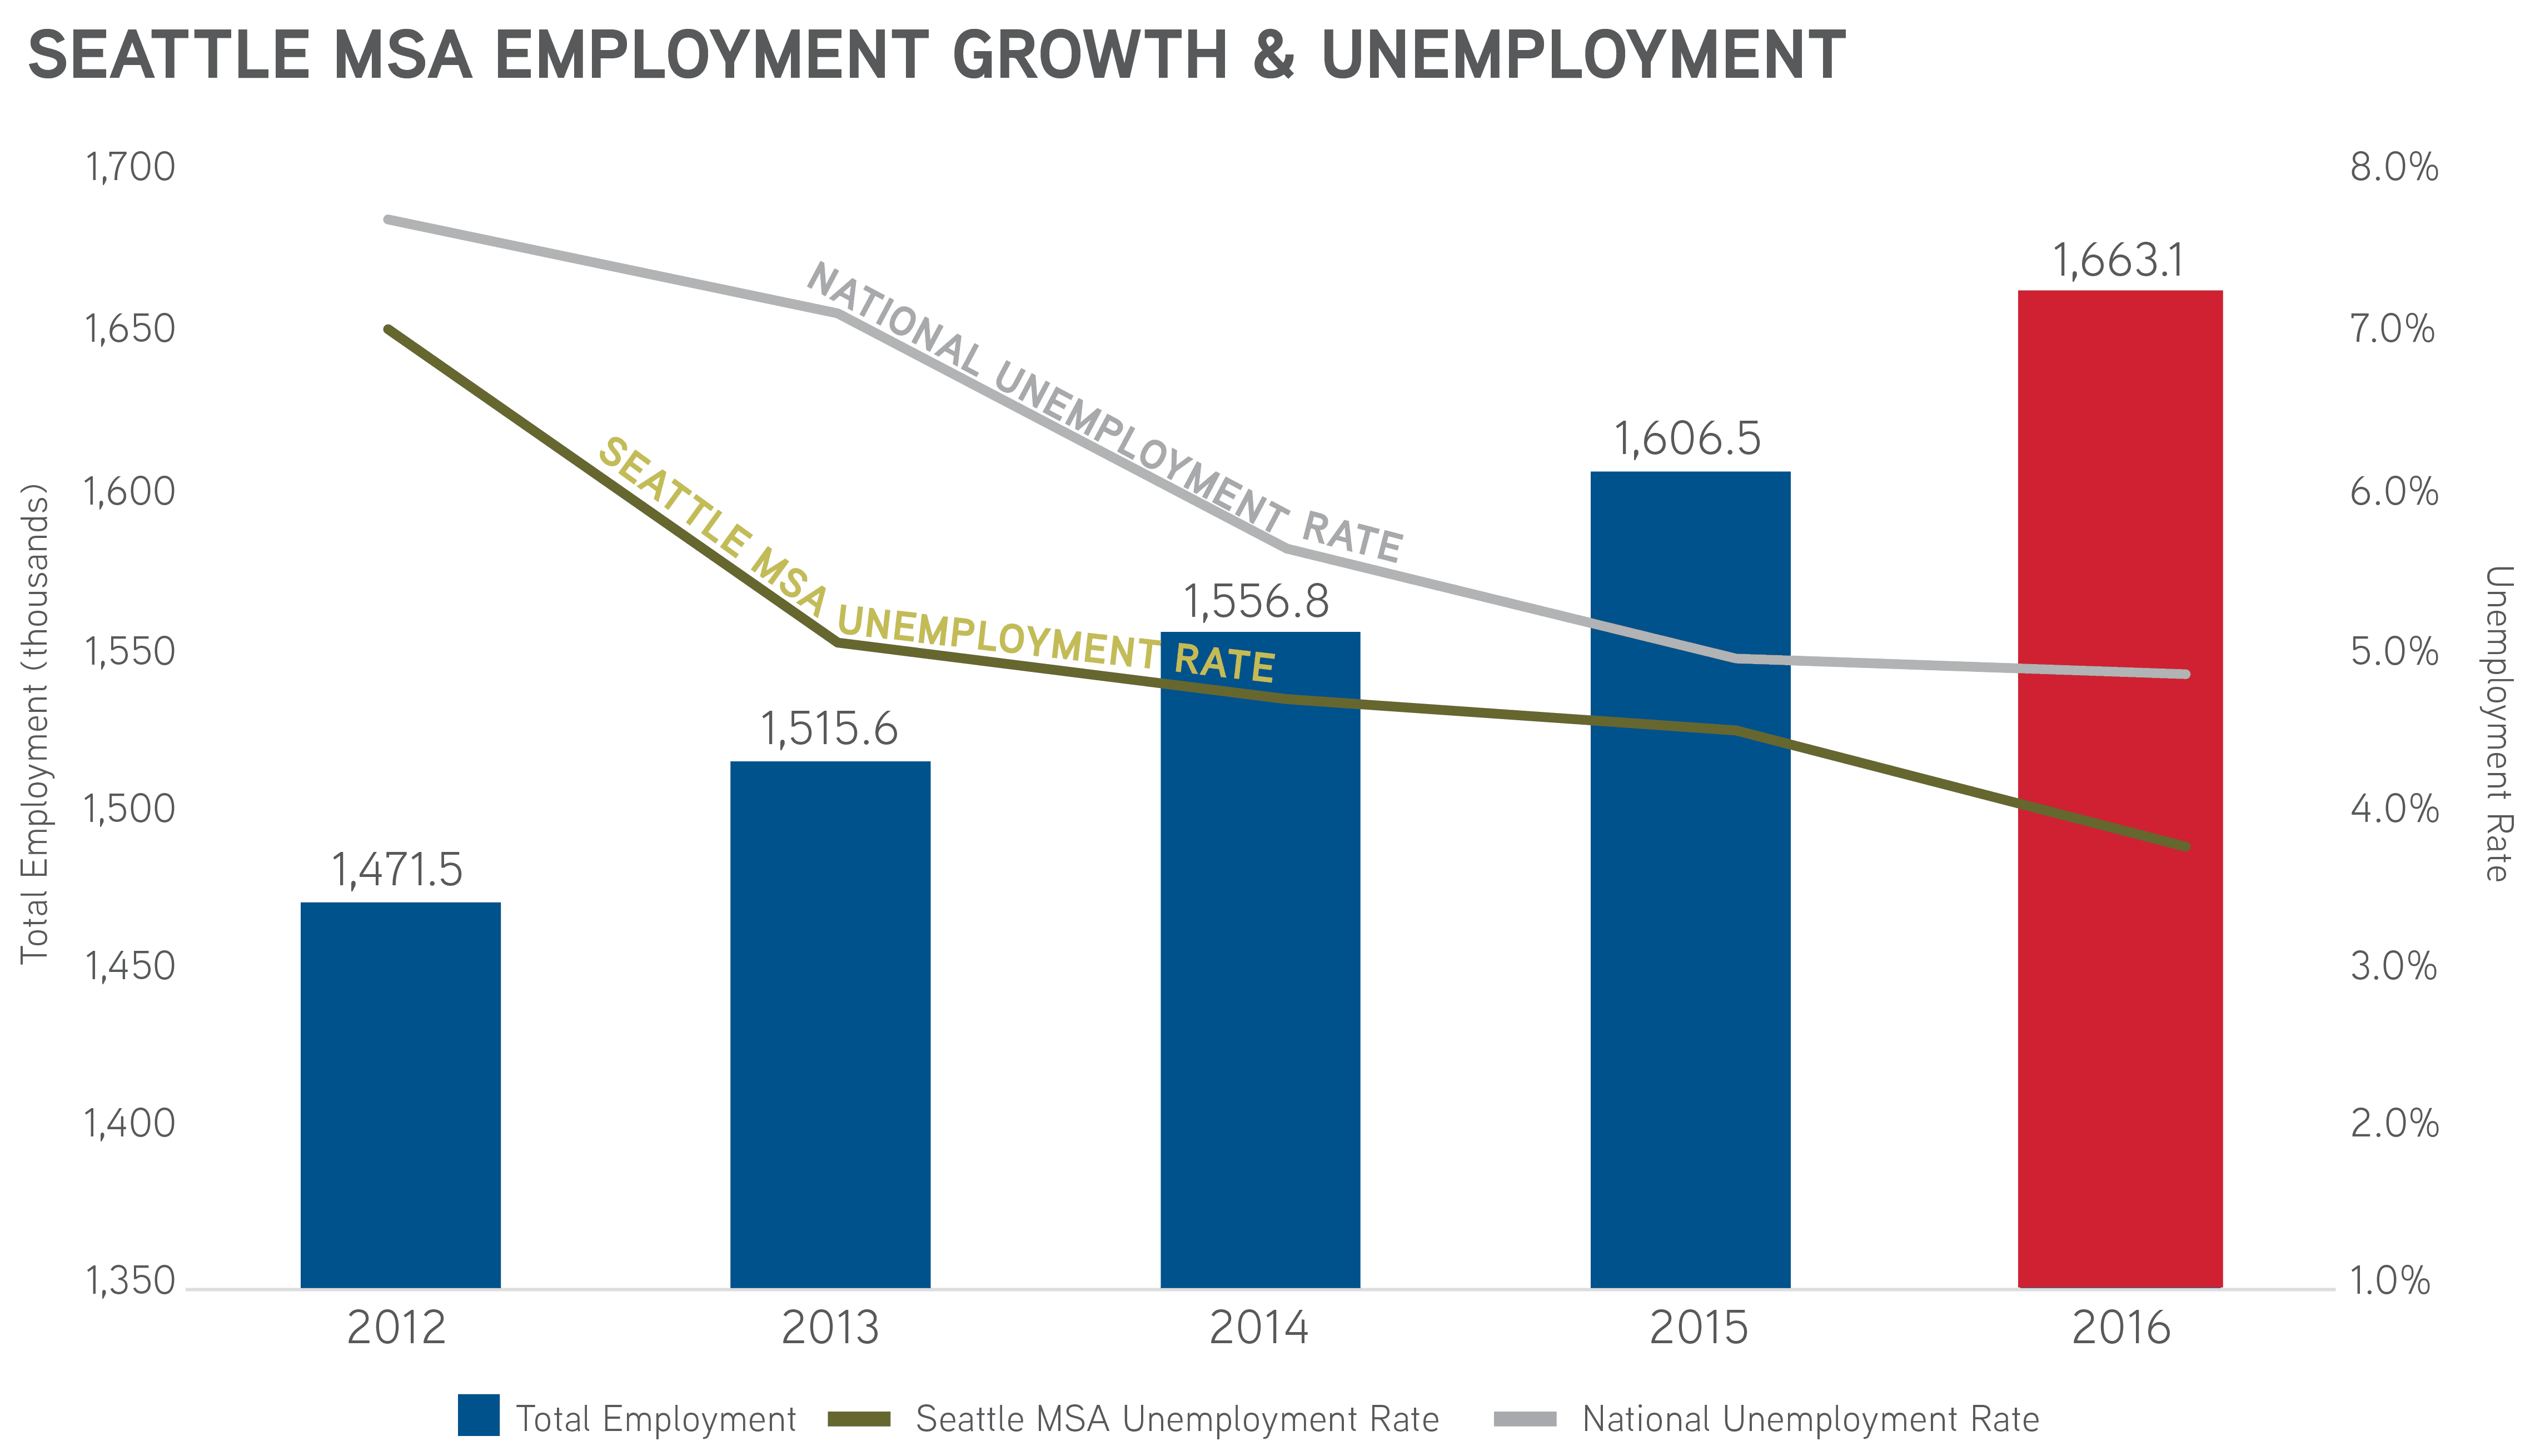
1. Job Growth Exceeded Expectations; Unemployment Low vs. the Nation
Job growth surpassed experts’ predictions for the past four years – to the delight of economists and apartment owners alike . Last year the Puget Sound Economic Forecaster predicted that King County would gain 45,500 jobs, and by end-of-year, we had added 56,600 jobs. Let the good times continue to roll!

The growth of new jobs resulted in Seattle’s incredible 3.7% unemployment rate, significantly lower than the nation’s unemployment rate of 4.7%. The hiring boom, lead by tech magnates such as Amazon, Google, and Facebook, translates into hiring booms in the service and retail sectors, too. The software engineer Amazon hires from San Francisco, for example, needs to find a favorite takeout place, a go-to bar, and of course a barista who knows their order.
If this level of hiring continues – and all signs indicate that it will – demand for new apartment units will continue. And apartment developers are up for the task!
2. Seattle’s Apartment Development Pipeline is Larger than Ever!
In 2010, King County’s inventory of apartments rested at 143,800 units. By 2020, that count could increase to 237,650 units – a 65%increase in a single decade. During the current economic expansion (2010 – 2016), apartment developers delivered nearly 39,000 units in King County and 46,000 units in the Tri-County region, with a primary focus on urban-located market-rate apartments.
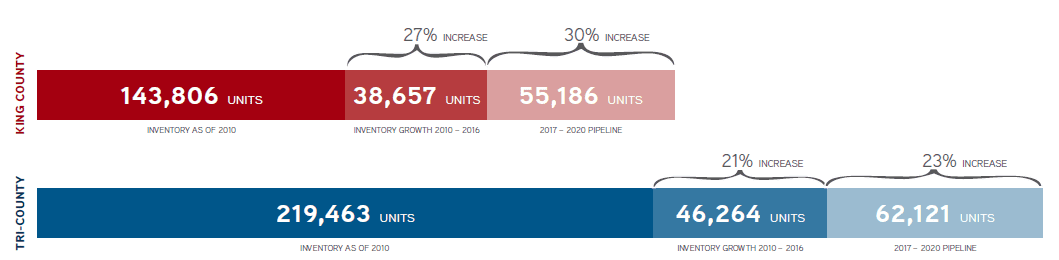
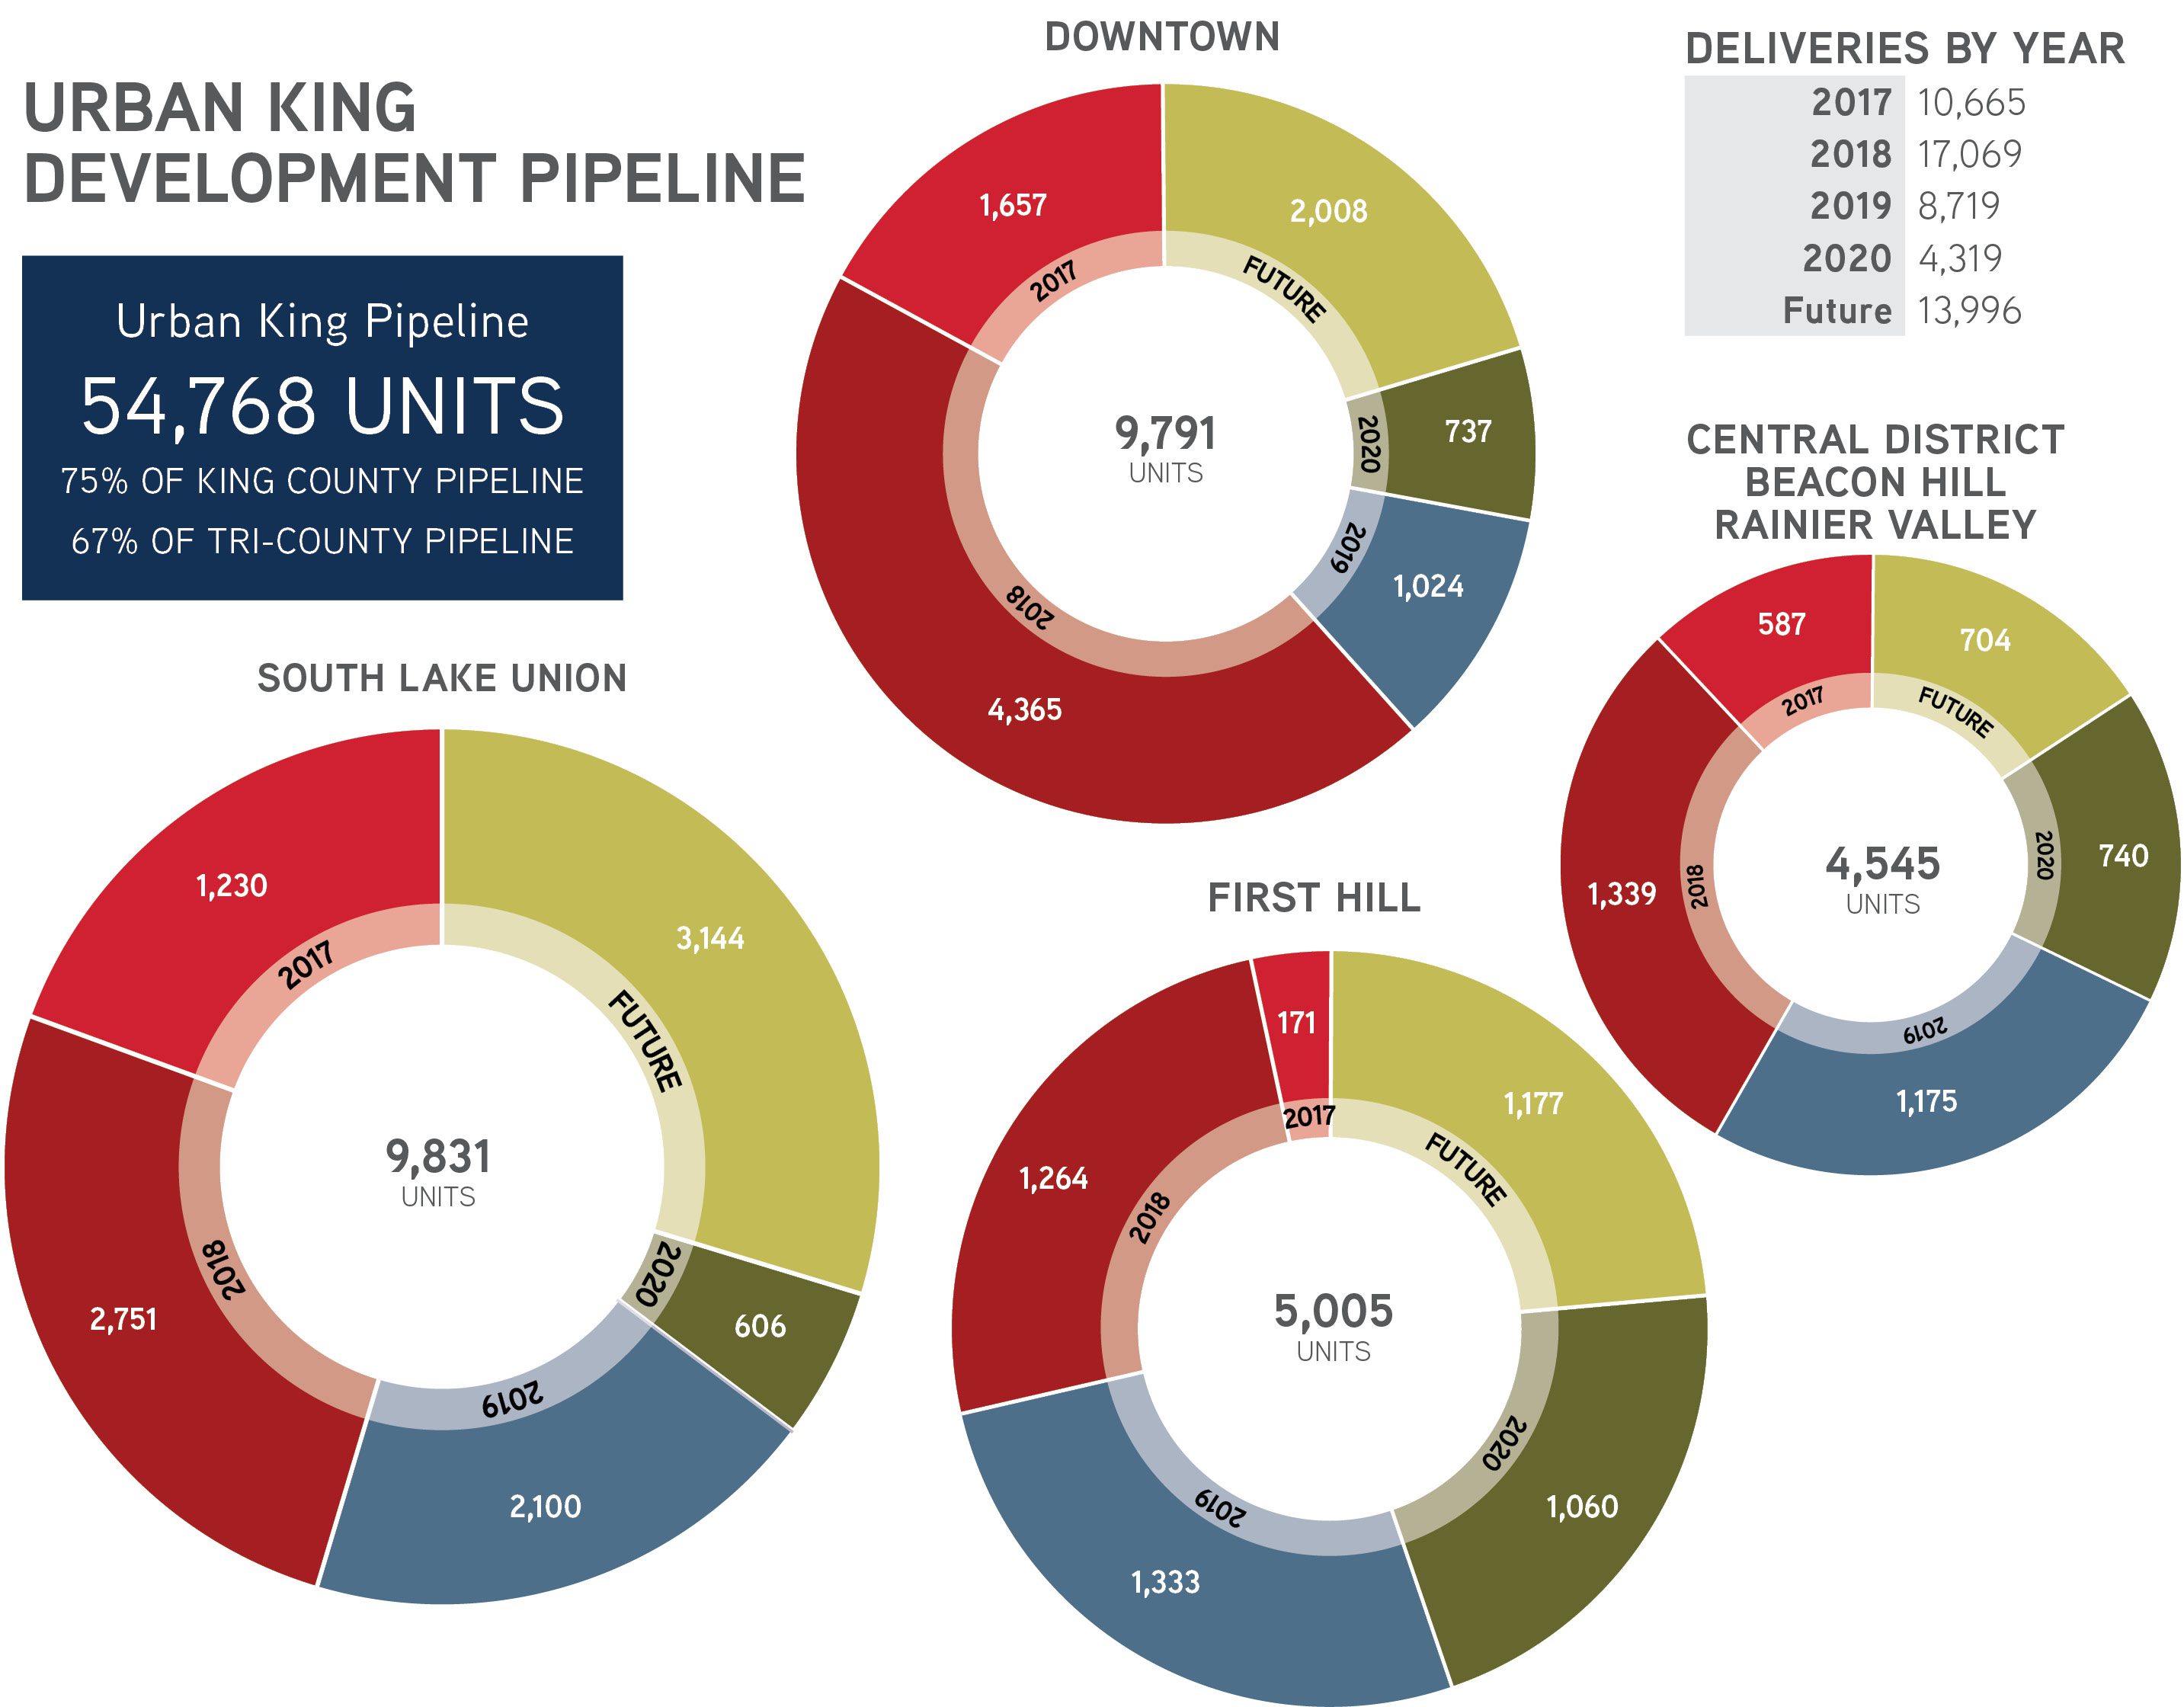
Where are we headed from here? Well, more than 77,000 units are scheduled for delivery in King and Snohomish counties in the next few years, with nearly 50% of that development planned for 2017 and 2018. Think you saw a lot of cranes in 2016, just wait!
Next week be sure to check out pages 16 through 18 of our 2017 Seattle Apartment Market Study to better understand new supply by neighborhood and year of delivery. Here is a snapshot:
3. Apartment Rental Rate Growth in the Suburbs Leads the Region
Although Seattle offers much to talk about, it’s been three years since Seattle’s urban market lead the region in rent growth. In 2016, the South King region (with submarkets like Kent and Burien) and South Snohomish (submarkets including Lynwood and Mountlake Terrace) lead all other markets in rental rate growth.
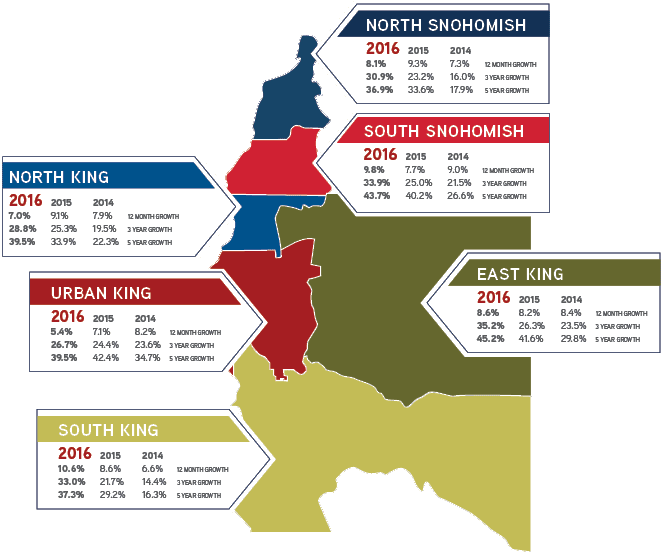
On average, apartment buildings in South King rent grew 10.6% in 2016, while South Snohomish experienced 9.8% rental rate growth over that same time period. With 45% cumulative rent growth over the last five years, East King experience the highest growth in the region.
This rent growth stems from residents fleeing the hyper-competitive markets of Seattle’s urban core, and suburban owners improving older units to meet demand from renters who arrive with more money in their pockets.
4. Vacancy Rates Remain Low Across All Markets

Despite rising rents across the region – and the delivery of over 46,000 new apartment units – almost all markets are still reporting sub-5% vacancy rates. Interestingly, vacancy rates remain lowest in the markets that experienced the most rent growth in 2016.
South King and South Snohomish posted the strongest year-over-year increases in average rental rates, yet these markets continue to outperform occupancy levels of other markets. The clear trend is movement outside of the urban cores of Seattle/Bellevue, yet enough stickiness to stay close enough to avoid long commutes.
Within our Market Studies, rent versus vacancy dynamics are covered in each of our region’s major submarkets as well as a more granular look in each urban neighborhood.
5. Sales Volume Highest Ever; Suburban Sales Setting New Records
It was another record-setting year for sales in Puget Sound, with over $5.5B in total apartment sales (compared to $4.7B in 2015). Overall the region experienced more sales volume, yet pricing metrics slipped a bit compared to 2015. However, it is clear that suburban sales won the blue ribbon in 2016.
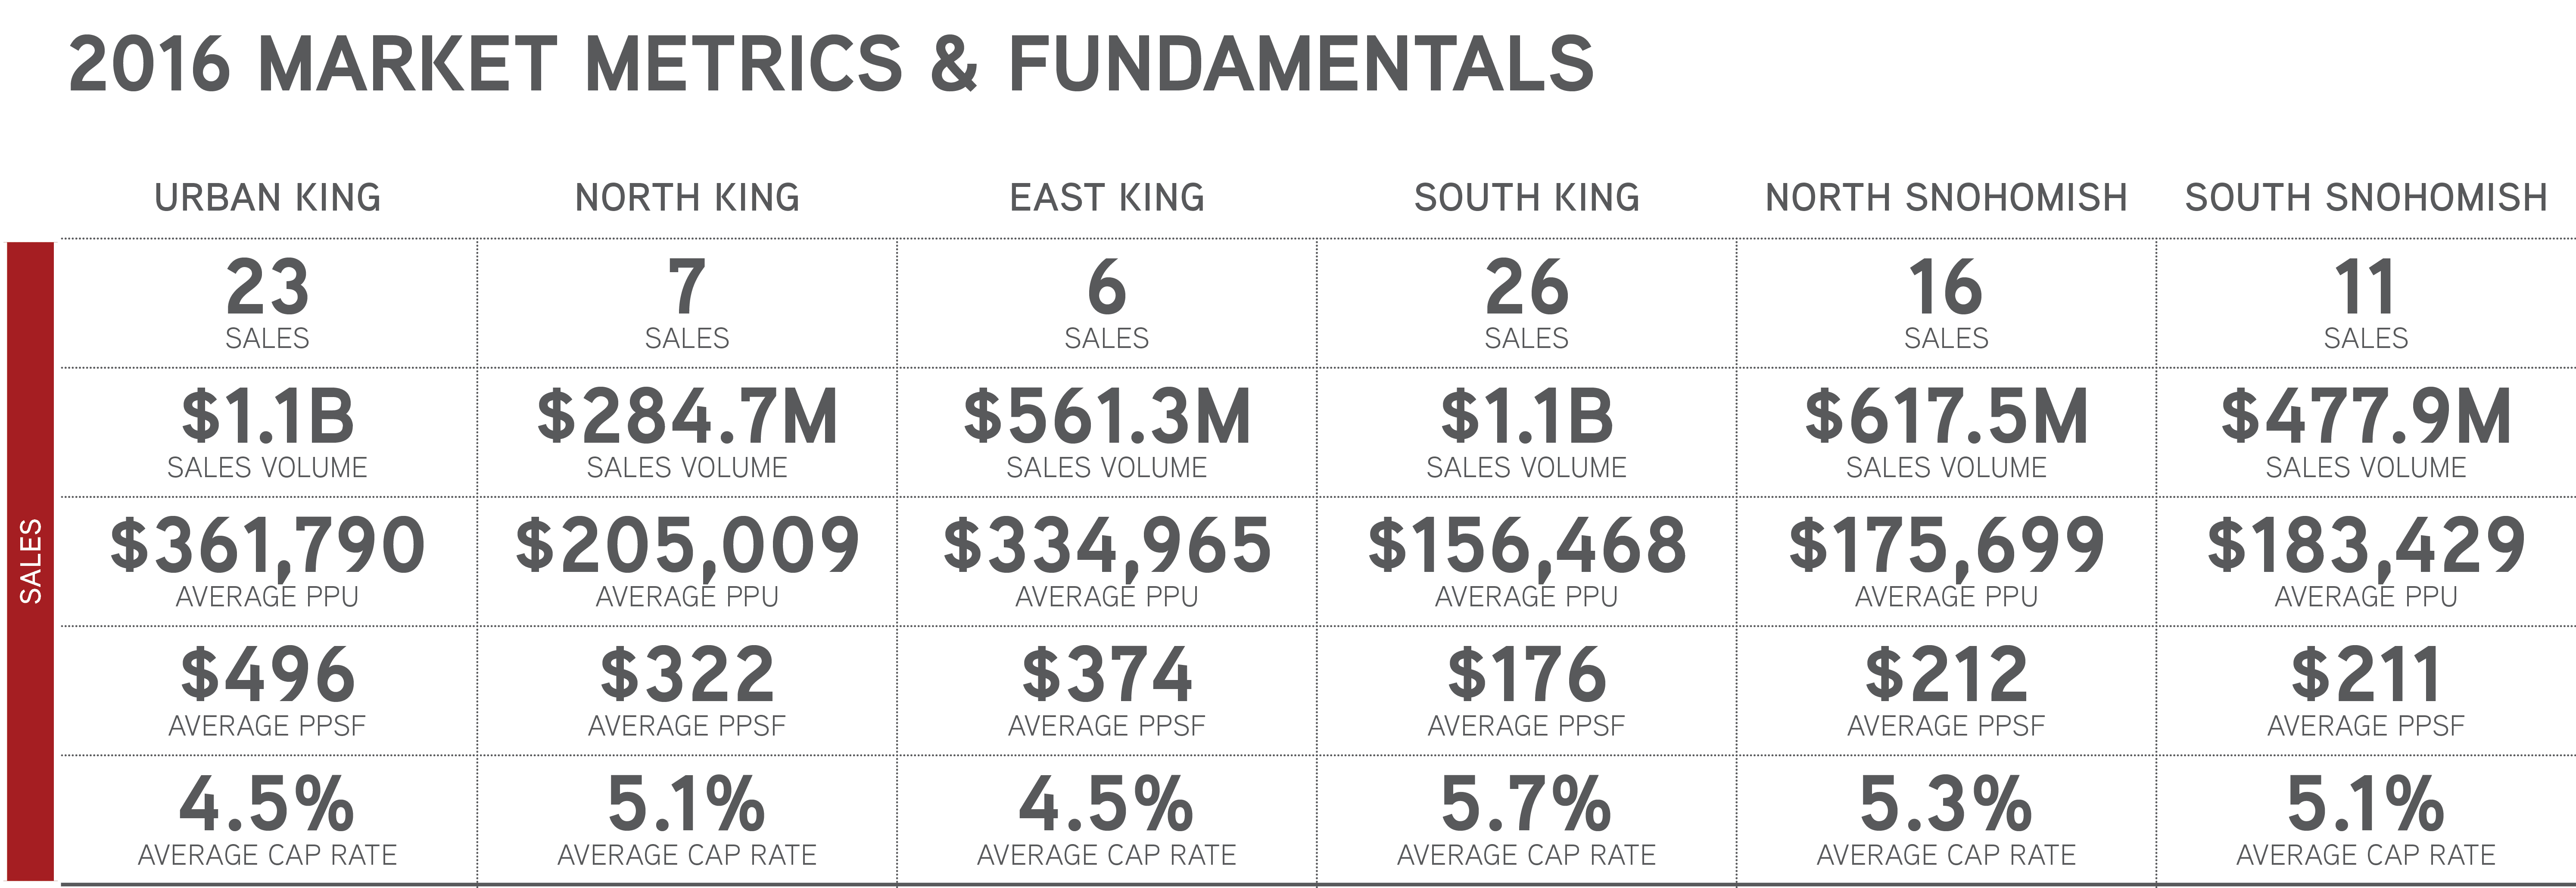
Some marquee sales of new buildings in urban markets made headlines this past year, yet the acceleration in pricing in the suburbs illustrates the predominance of investor demand. For the first time ever, the average price-per-unit of sales in all suburban markets exceeded $150,000/unit. Remember, many of these buildings are more than 30 years old!
Here is a snapshot of sales trends in North Snohomish:
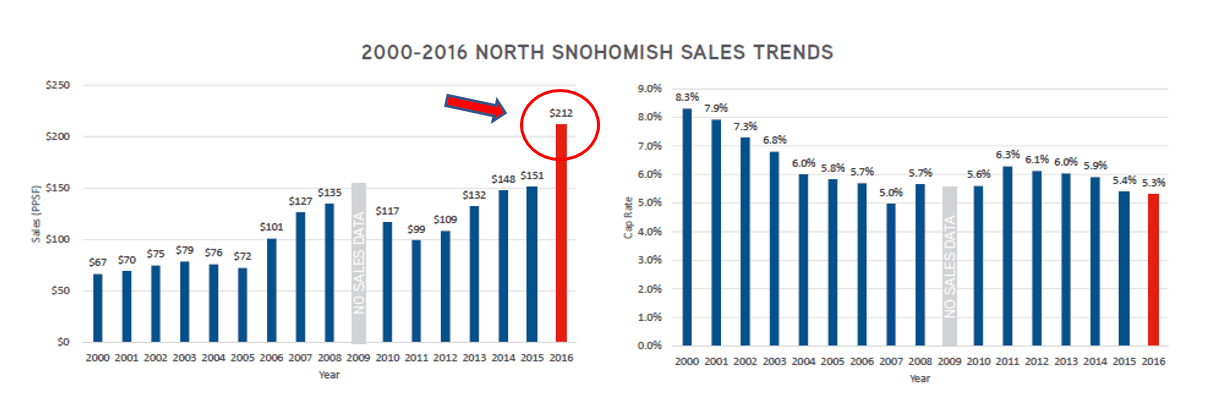
Sources: Real Capital Analytics, Dupre + Scott, CoStar, Colliers Research
Pricing on a per-square-foot basis in 2016 increased 57% over the previous market peak in 2017 – and this occurred without the boost of sales of new, expensive apartment buildings.
In smaller (sub-50 unit) buildings, sales pricing similarly surged – increasing 20% in average price-per-square-foot (from $335 in 2015 to $401 in 2016). Yet, in this case the boost was partially driven by sales of newly constructed apartment buildings with smaller units.
Please take a look at each of our Market Studies for deeper analysis and complete coverage of both King and Snohomish Counties.