


The question of apartment absorption (and its corollary, demand) is omnipresent in the minds of apartment investors in the Seattle region. Ever since the apartment market emerged from the Great Recession in 2010 and the development pipeline began to mount, investors questioned when demand would slack. The end of 2015 is upon us… so where do we stand? Pretty damn tall!
Over the last several years the great majority of new development found a home in urban infill markets, specifically adjacent and nearby downtown Seattle and West Bellevue. These markets account for between 75% – 80% of all apartment development in the Tri-County region, and therefore provide a good measure of the market’s health and stability.
Delineated below by twelve micro-markets / neighborhoods, deliveries from 2013 to present total nearly 12,500 units – breaking down to a touch over 1,000 units delivered each quarter. Overall vacancy as of Q3 2015 averages an impressively low 3.53%. This measure of vacancy is “market vacancy”, which excludes projects in lease-up. Taking newly delivered projects into consideration – “gross vacancy”, results in a vacancy rate that rises only to 6.52%.
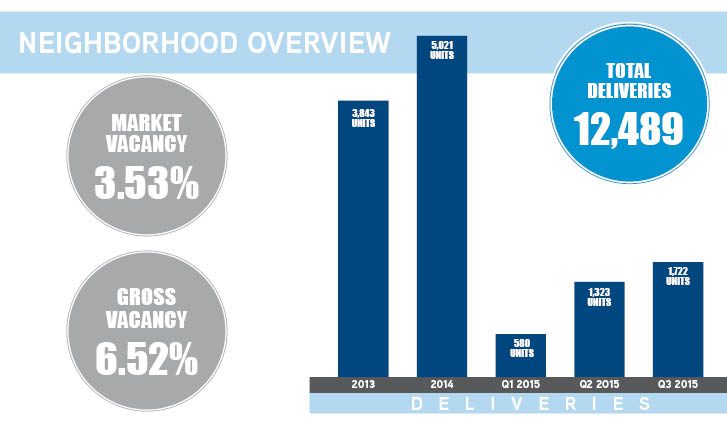
Dupre + Scott Apartment Advisors by far provides the best data allowing comparison between deliveries and absorption. Their data is so good that we can track both market vacancy (stabilized projects) and gross vacancy (accounting for buildings in lease-up) in order to assess velocity of absorption.
The following summary analyzes deliveries and absorption in each neighborhood, providing deeper insight into both the volume and impact of apartment deliveries over the last several years.
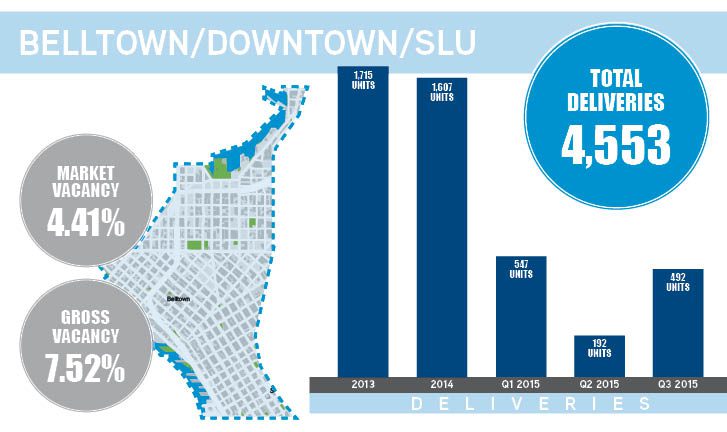
The largest of the neighborhoods measured, these ultra-core neighborhoods have experienced an average of over 1,300 units delivered each year. Both market vacancy and gross vacancy are higher than most all of the other neighborhoods, yet remain at very healthy levels. With over 4,500 units delivered since the start of 2013, these markets can still boast a sub-5% vacancy rate.
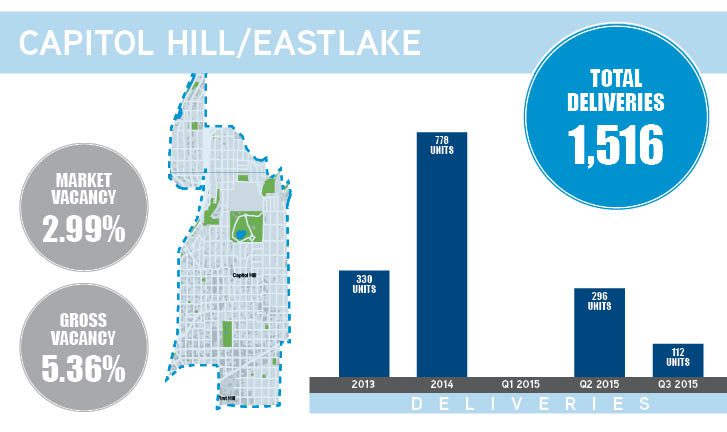
Capitol Hill and Eastlake have averaged just over 500 units delivered each year. The health of these markets is apparent in a sub-3% market vacancy rate and gross vacancy a tick over 5% despite a healthy number of deliveries in each of Q2 and Q3 2015.
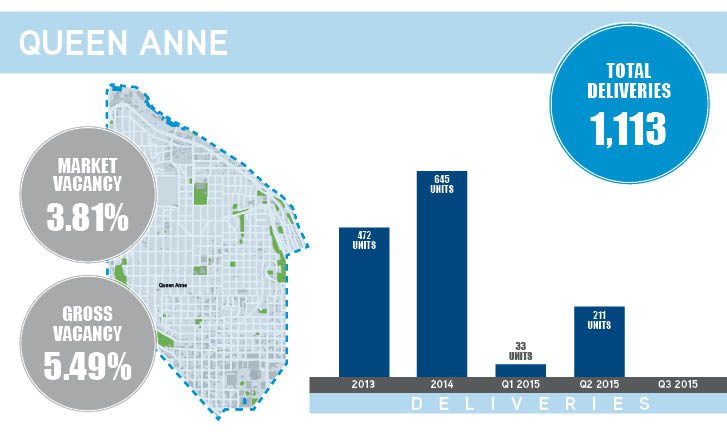
Known as a very tight market, developers have managed to add over 450 units a year in Queen Anne for the past several years. Vacancy rates have remained very stable, proving the current resilience of the Queen Anne neighborhood.
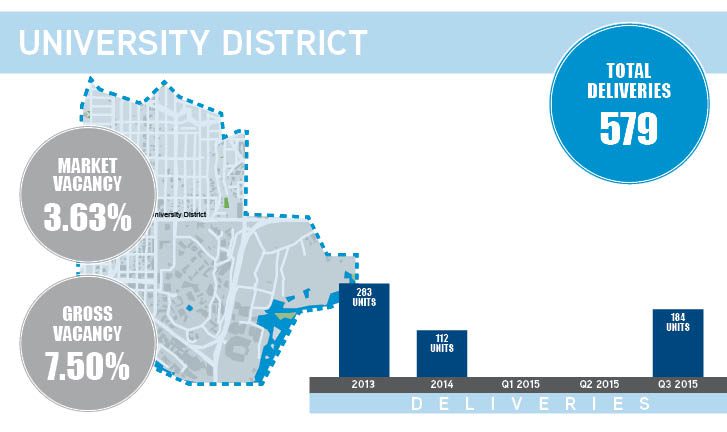
The University District experienced the least amount of development of all Seattle neighborhoods measured, totaling approximately 600 units since the beginning of 2013. Surprisingly, gross vacancy exceeds the average of all markets by nearly 100 BP – currently at 7.50%.
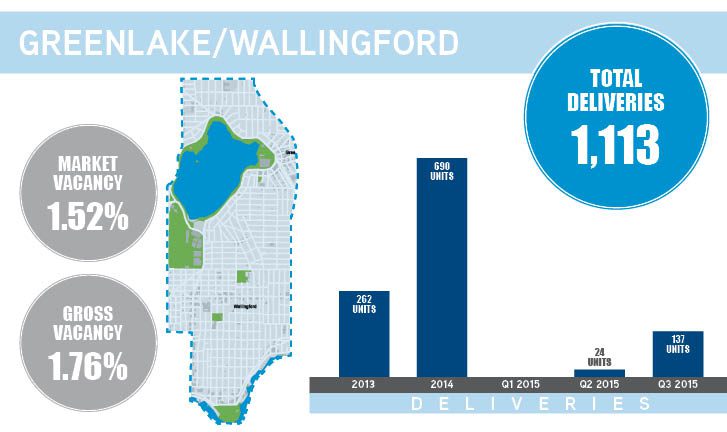
These neighborhoods, just north of the shipping canal, exhibit the tightest occupancy levels of all markets measured. Both market and gross vacancy comfortably reside sub-2%. Although over 1,100 units were delivered in the last three years, this submarket shows exceptional fundamentals.
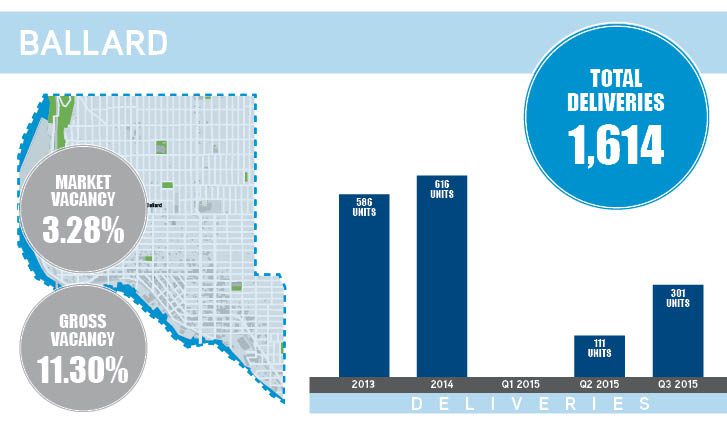
Ballard’s development pipeline is storied – as is the fact that it is one of the few markets where the development pipeline exceeds pre-2010 inventory. Given that from 2013 to present Ballard both doubled its inventory and added more units than any other single neighborhood, it is not surprising that it is currently experiencing double-digit gross vacancy. It is important to note, however, that market vacancy in Ballard is currently sub-3.3% — not too shabby!
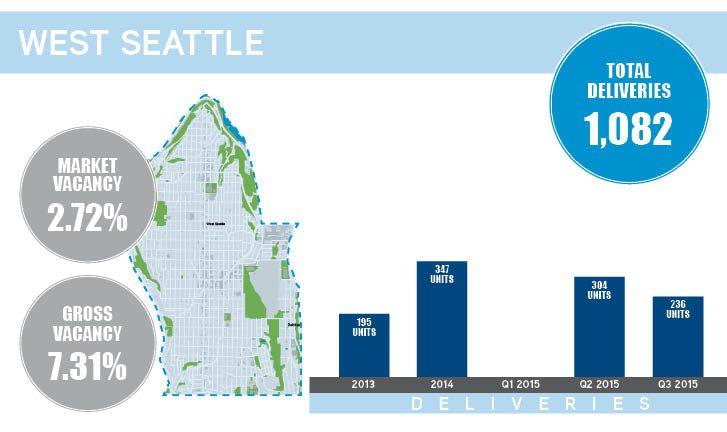
West Seattle is Ballard’s southwestern twin (forming a “barbell’ on either side of downtown Seattle). Similar to Ballard, the apartment stock in West Seattle pre-2010 was quite minimal. In the last three years West Seattle added over 1,000 units to its nascently forming inventory, yet market vacancy is a remarkable 3.38% and gross vacancy is a very respectable 7.31%.
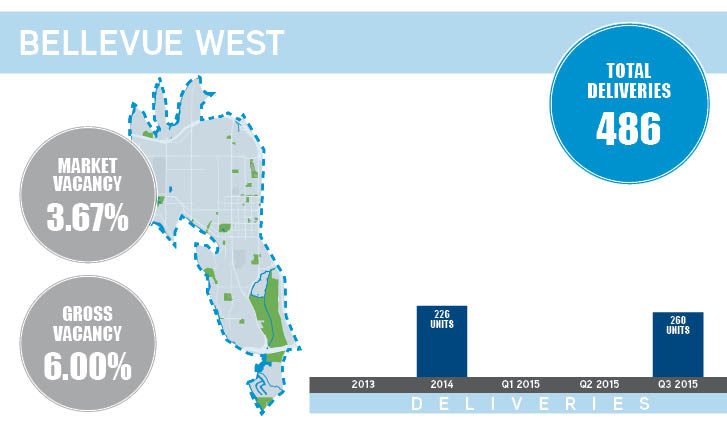
Venturing beyond the metaphoric shores of Seattle (or at least beyond the western shores of Lake Washington), West Bellevue is slow to add apartment inventory this cycle – adding less than 500 units to this submarket since 2013. As one would accordingly expect, market vacancy remains low, as well as gross vacancy. Look for these figures to change as an onslaught of apartment development passes through entitlement in this Eastside market.
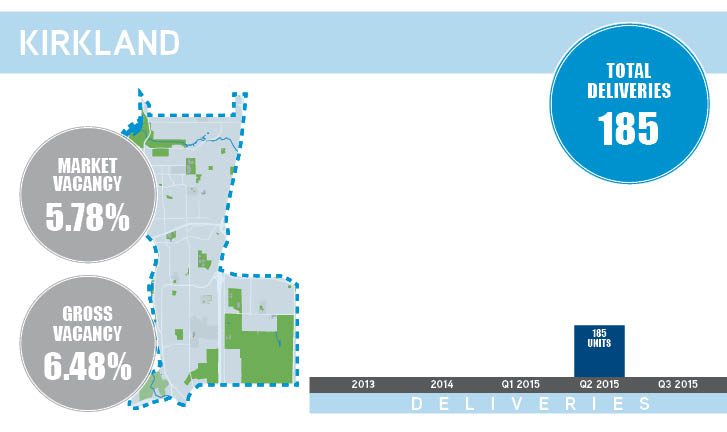
Kirkland’s market dynamics do not totally sync with the relatively small quantum of apartment deliveries received by this very tight market. All in all, less than 200 units were delivered in the last three years in Kirkland, yet market vacancy is the highest reported of all markets measured. The spread between market vacancy and gross vacancy is a mere 60 BP, proving that further investigation is warranted.
All of the foregoing begs a few distinct questions. Foremost, to what do we attribute such phenomenal absorption/demand? Quite simple, job growth. In the last three years our region has added over 150,000 jobs – many of which are high-paying and urban located.
Second, what is to come? What we know for sure – much, much more development. What we are less sure of is continued job growth at the current pace. To better understand how many units are planned for each of these neighborhoods beyond 2015 stay tuned for further writings – or give us a call to discuss your apartment holdings and strategies.
Understanding both future and current market dynamics is critically important in positioning both your assets and your investment thesis for optimum results into the future. Our apartment investment sales team, comprised of four highly qualified professionals, and a back-office team of an additional four dedicated staff, specializes in assisting apartment owners in maximizing returns. Please give me a call to discuss how we can turn our expertise into your profit. – Dylan