

Getting a sense of which direction the wind is blowing when it comes to the sale of Seattle and Puget Sound apartment buildings is no easy feat. Concessions, declining rental rates, cap rate compression, and interest rate fluctuations all played a role in recent sales.
Despite a monumental availability of capital for investment, the sales market nearly came to a halt by the Spring of 2020.
How is the market looking 12 months later?
Analyzing graphical data and trends demonstrated by the following metrics is telling:
1. Sales Volume: How much is getting sold
2. Sales Price Distribution: Where are sales getting done
3. Pricing: Price per Unit
4. Pricing: Cap Rates
5. Rental Rates: Daily Asking Rent
How are you looking at opportunities in the market?
Are you a buyer?
A seller?
Will you act presciently enough to seize opportunities not seen by others?
Sales Volume
Entering 2020, apartment investors knew that there was little possibility that 2020 could outpace the $7.4B record-setting sales volume experienced in 2019. Yet, with the onset of COVID shutdowns by mid-March 2020, precipitous a drop-off in sales volume was predicted.
During COVID the marketing of apartment buildings for sale was light – with many transactions consummated off-market as the broader market waited-out the pandemic. However, in truly hockey-stick fashion, apartment sales picked-up pace by Q3 2020 and the year ended shy of $3B in total sales.
The start to 2021 feels different already and although we are not yet at mid-year, listing volume is up markedly and closed sales as of May are nearly outpacing Q3 2020 sales totals.
With cheap money, occupancy stabilizing, and rental rates growing – even in core-urban Seattle markets – expect the bid-ask spread to narrow and sales volume to accelerate to pre-pandemic levels.
Puget Sound Apartment Sales Volume
2020 vs. 2021 YTD

Source: CoStar
Sales Price Distribution
A metric we don’t often track is the size of transactions in the marketplace – and better put, the distribution of transaction sizes in the market.
Year-to-day, 50% of total sales volume occurred between pricing of $1.2M and $5.2M, and less than 10% of all sales were over $43M transactions. This is a carry-over from 2020, when average transaction sizes were sub-$10M, much different than previous years (like 2019) when large transactions ruled.
Over the last 12 months, deals getting done were mostly with private families, individuals, and smaller real estate companies. Larger institutions, working with institutional capital, were less apt to transact during market turbulence created by COVID, and leading into 2021. That tide began to stem in the last few months.
April 2021 marked an increase in large apartment buildings coming to market and that trend is expected to continue. Capital likes to keep moving and the 12-month slowdown from March 2020 to March 2021 seemed to create enough pent-up demand for larger-transaction activity to break-free; expect distribution of sales value to move to the right of the below graph.
Puget Sound Apartment Sales Distribution by Value
2021 YTD

Source: CoStar
Sales Prices
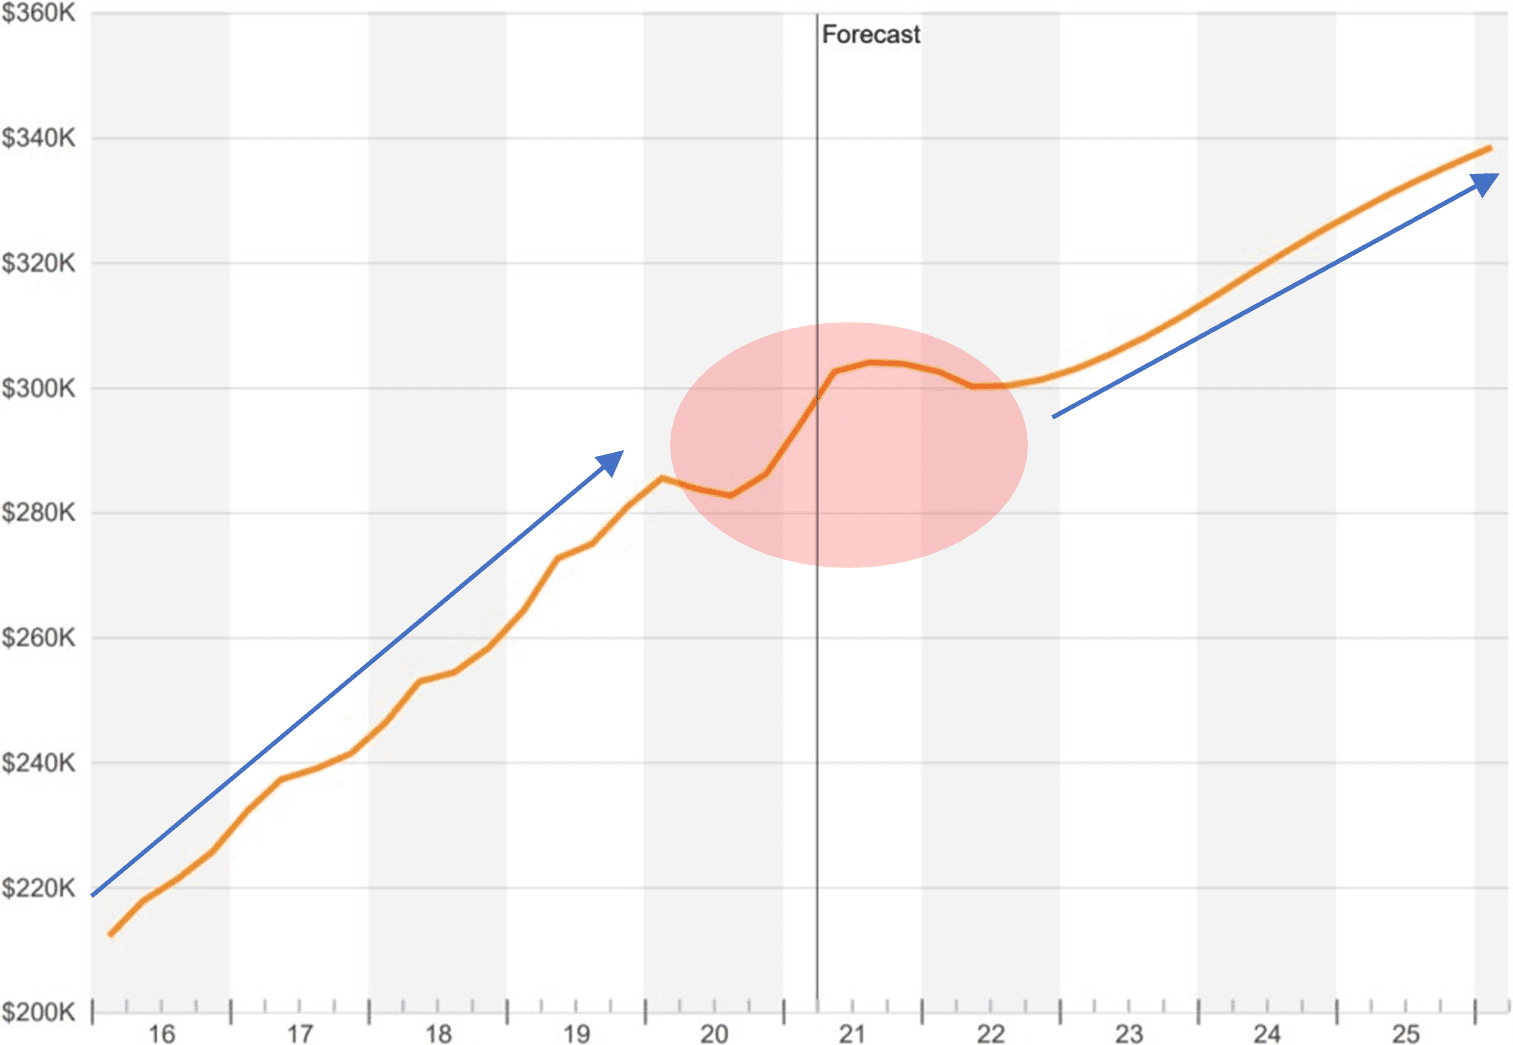
Puget Sound Apartment Sales – Price per Unit
5 Year Trend / 5 Year Forecast
Sales pricing of apartment buildings are dependent of many factors – yet the biggest levers of value are rental rates and cap rates. As is demonstrated below, over the course of the last 5 years rental rates increased while cap rates compressed – resulting in continually escalating sales prices.
Although cap rates surprisingly declined during COVID, it’s no surprise that rental rates subsided (or dropped precipitously) in 2020. Resultantly, pricing declined. Viewed over the course of a 5-year trend, the drop in pricing was neither monumental nor sustained.
Pricing appears to have nearly regained momentum to the point of mean reversion to the previous annual upward trajectory of apartment sales values. Further growth of value – forecast below – postulates a return to sustained annual value growth, but only after the market likely calibrates over the next 12 months. Part of this recalibration is a recent acceleration in pricing!
Source: CoStar
Capitalization Rates
Capitalization rates – a favorite subject of commercial real estate investors, pundits, and academics alike – are not only a measure of rate-of-return, but investor sentiment/demand. In becoming a Tier 1 market, Seattle, and the Puget Sound, were minted “investment-grade”, a fact that was solidified by an influx of capital over the last 10 years and concomitant cap rate compression – a true signal of high investor demand.
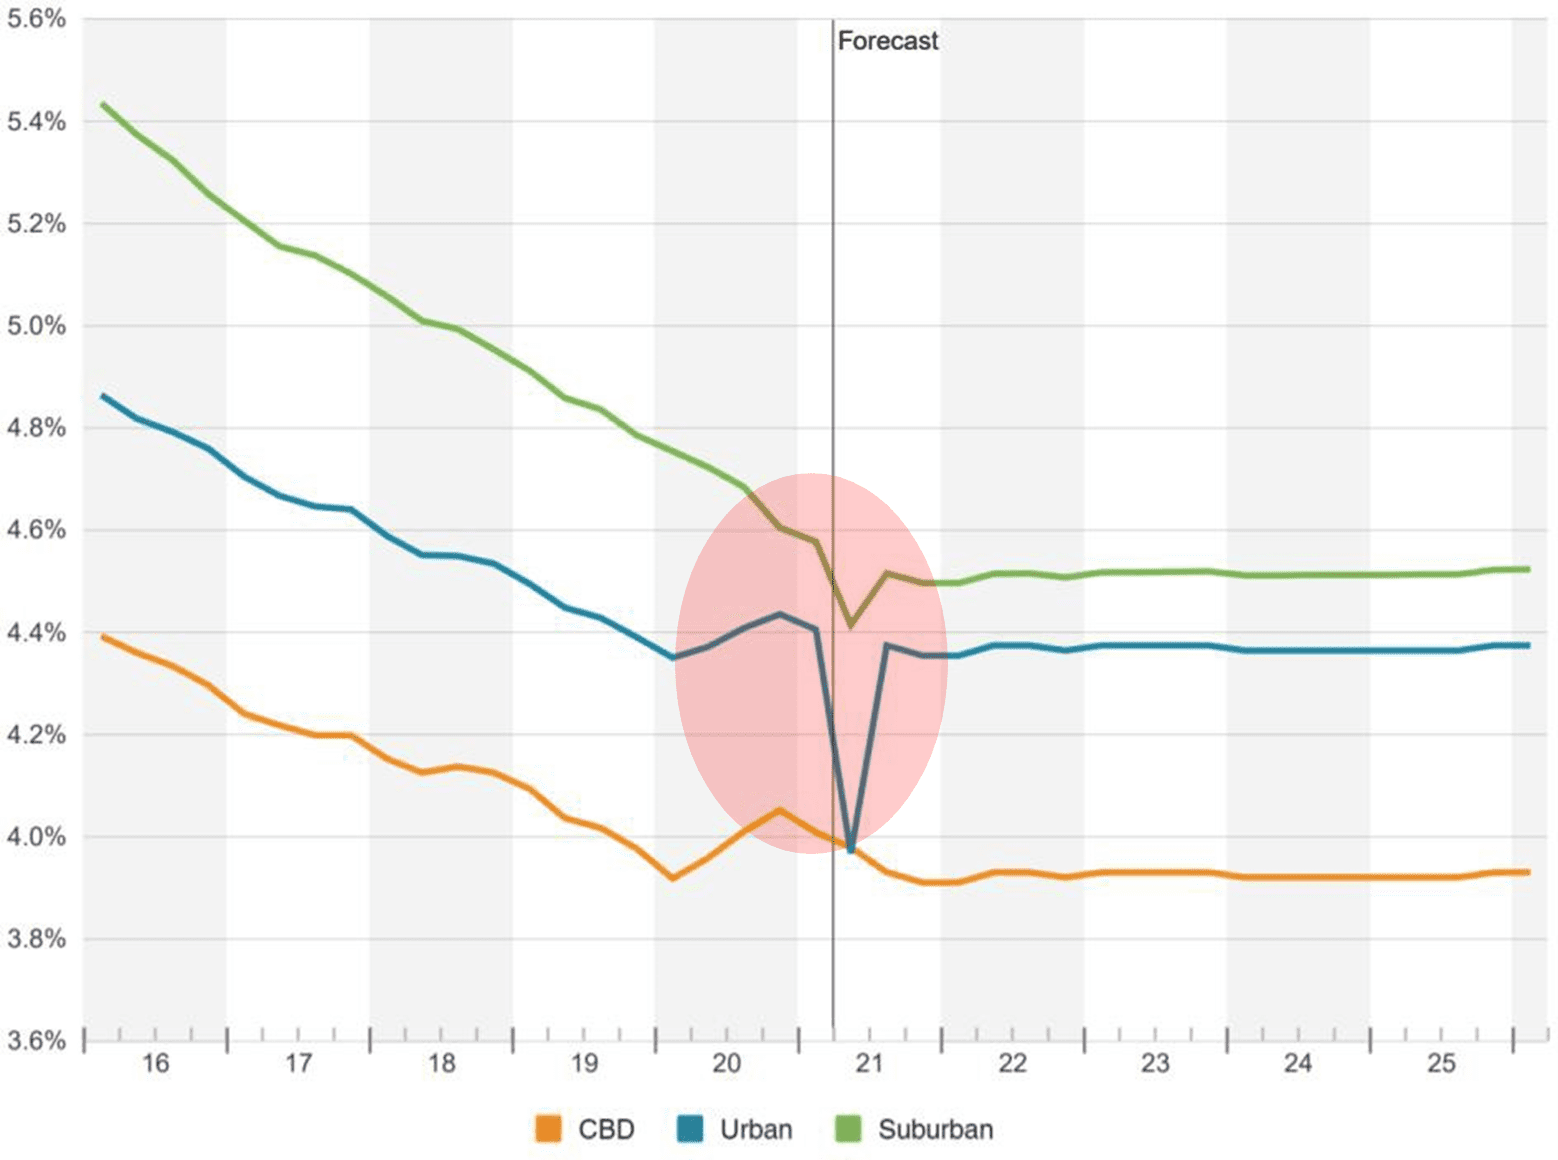
In each of the last 5 years cap rates compressed. The onset of COVID had the predictable result of cap rate expansion, a sign of investor caution as the world waited to see the impacts of COVID on the apartment market.
However, what was not expected was a marked compression of cap rates in Puget Sound.
A few factors contributed to compression in cap rates.
- Apartment buildings simply collected less income in 2020, yet investors were willing to pay pricing inline with pre-COVID valuations (not always).
- Scarcity of opportunities led to more aggressive pricing.
- Regional job growth and stability – compared to other regions – created more competition from buyers looking to place dollars in Puget Sound.
What does the future hold for cap rates?
If inflation takes hold, and monetary policy is used to combat inflationary pressures, interest rates will rise and cap rates likely will as well. However, as apartments as an asset class remain a favorite investment, inflationary pressures may not be enough to increase cap rates (desirability of real estate serving as an inflationary hedge).
Our prediction is that cap rates are sure to momentarily rise with rising interest rates, yet cap rates will likely fall below previous levels once apartment investors are convinced that we’ve entered the next expansion cycle.
Puget Sound Apartment Sales – Cap Rates
5 Year Trend / 5 Year Forecast
Source: CoStar
Rental Rates
We’re back, baby!
Well, sort of.
The below data suggests that rental rates across the Puget Sound are back to pre-pandemic levels. And aggregated together, that may be true, yet it does not tell the entire story.
Suburban Markets
For all the flack the not sexy, nor cool suburbs took during this past market cycle, they sure came back into vogue in 2020.
I don’t need to retell stories of an exodus from cities this past year. Despite moratoriums on both eviction and raising rental rates, suburban markets (in general) held rental rates fairly firm, and in many cases grew rental rates on newly signed leases. The suburbs were not without challenges – collection loss, principally.
In 2021, the suburbs remain the benefactors of sustained demand from what otherwise would-be downtown, urban renters competing for leases with suburbanites. Accordingly, rent growth in the suburbs is not only positive – these increases are carrying the load of rent growth for the region.
Urban Markets
Massively declining rents (on the order of magnitude of 15% to 30%) are to blame for most of the decline in apartment rental rates in the Puget Sound region. However, as of January 2021, urban rental rates not only hit bottom, but they’ve begun to rebound.
Are urban rents back to pre-COVID levels? Not yet.
However, urban rental rates are rebounding, and coupled with strong rental rate growth in the suburbs, the data demonstrates that aggregated regional asking rents are already back to pre-COVID levels!
Puget Sound Apartment Market – Daily Asking Rent (SF)
5 Year Trend
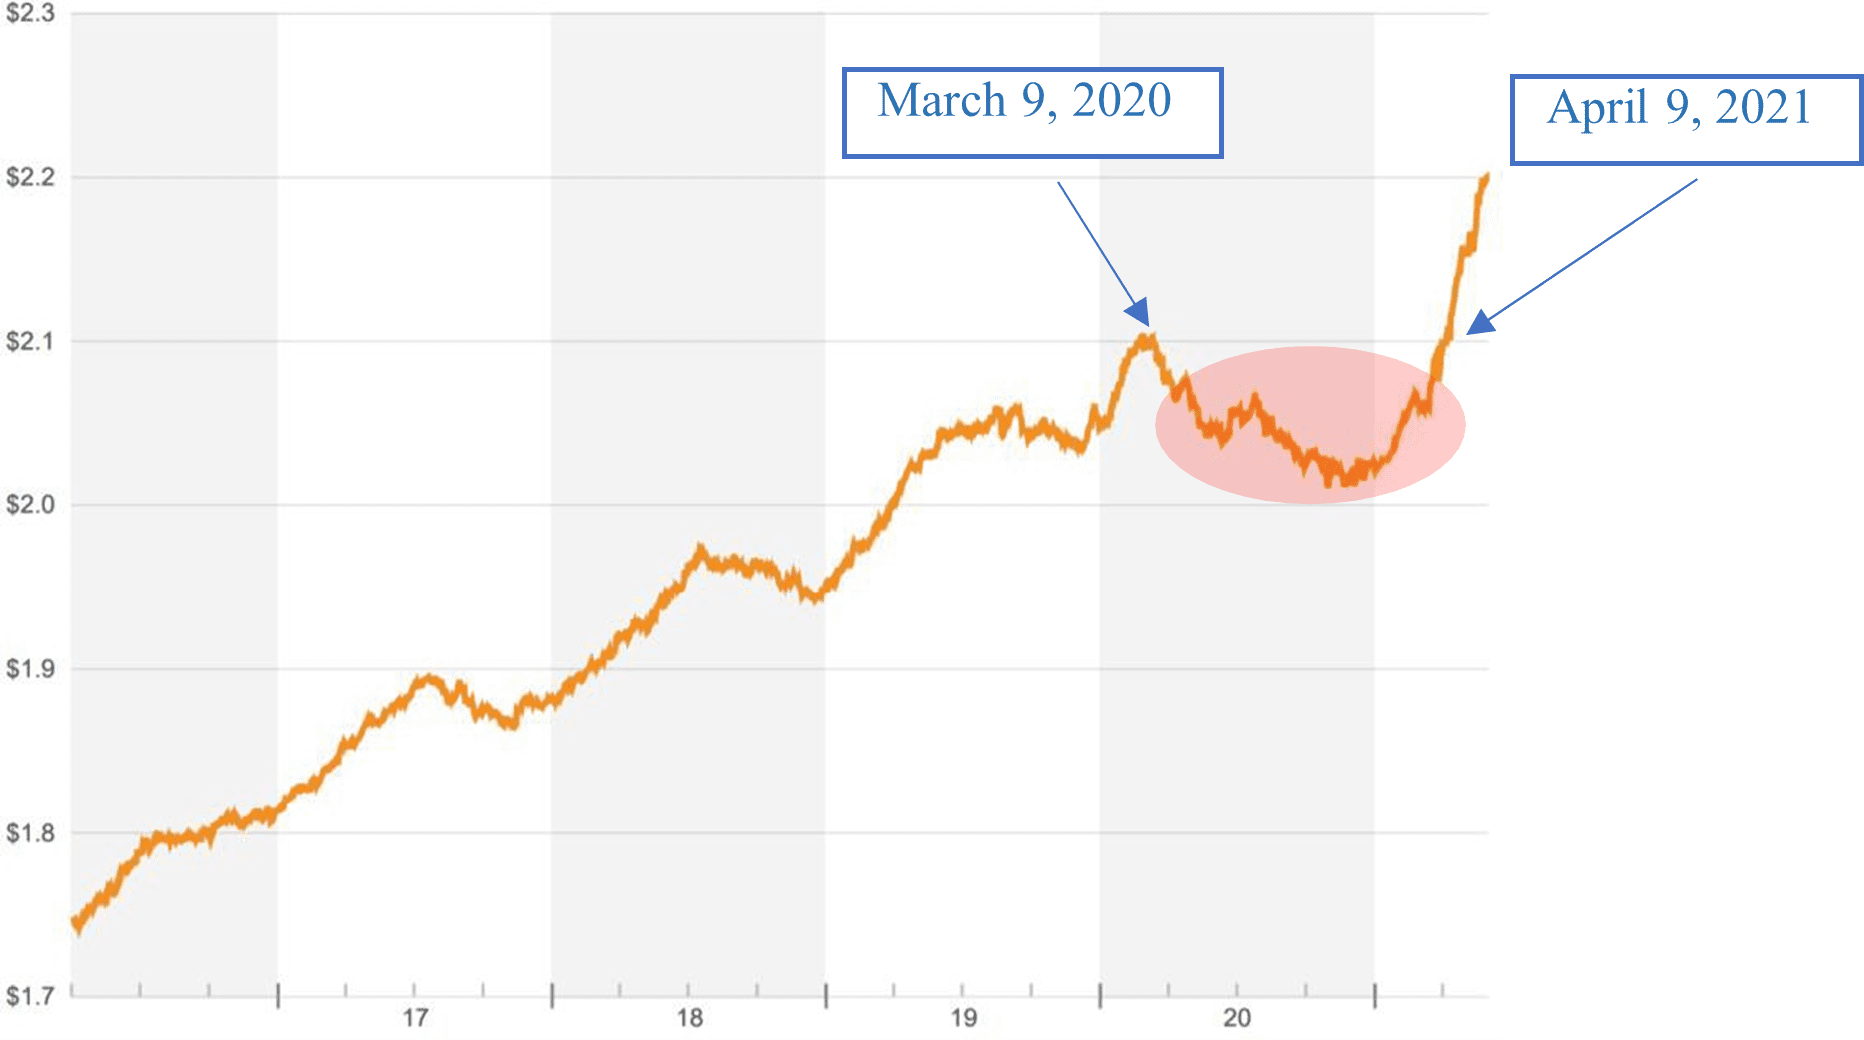
Source: CoStar
Get in the market, not too long from now you’ll be glad that you did!
We can help with a Free Valuation of Your Apartment Building or answering questions about what/where to buy.
Working with a capable, experienced, and active team of apartment sales and lending experts is always important–and such sage guidance was never more necessary than it is today.
Give us a call to Turn Our Expertise into Your Profit!