
In January of this year I proclaimed that Seattle is [white] hot in 2015! and in February 2015 I discussed Factors Driving Up Seattle Apartment Values Persist in 2015. The numbers are in for the first half of 2015 and it is no surprise that 2015 is another banner year for the Pacific Northwest apartment market. Which markets continues to surge?
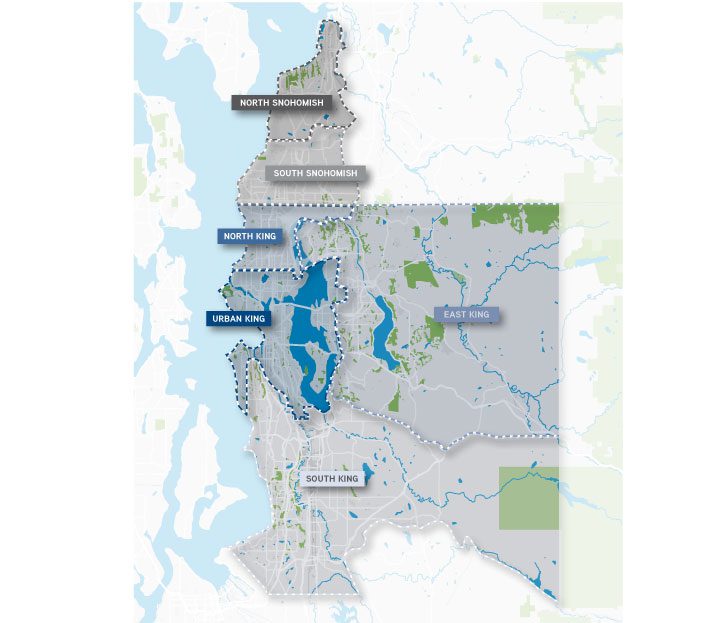
In the following post we will break down YTD sales metrics and y-o-y changes for the following submarkets:
- Urban King County
- North King County
- South King County
- North Snohomish County
- South Snohomish County
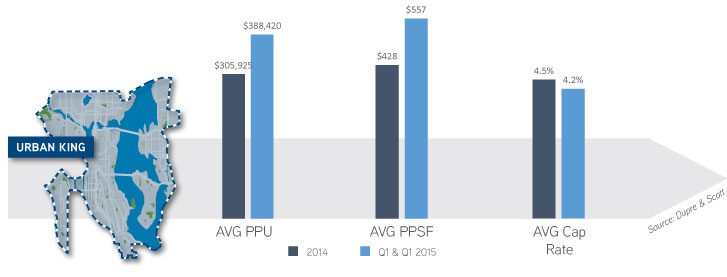
Urban King County
Without a doubt, investment sales in Urban King County have continued their momentum into 2015, and continue to escalate. Average PPU for sales thus far this year have nearly crested $400,000/unit, compared to just over a $300,000/unit average in 2014. PPSF has also risen, averaging $557 NRSF. Amazingly, cap rates have dropped even lower than those reported in 2014 – likely due to both increased competition amongst buyers and a 10 year treasury bond below the 2.5% constant set in 2014.
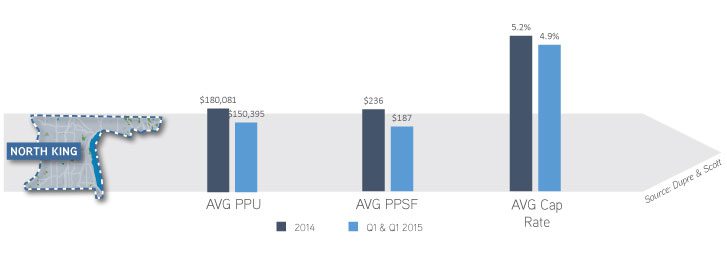
North King County
North King County has yet to hit the stride it reached by EOY 2014. PPU and PPSF metrics in 2015 remain below 2014 levels, by nearly 20% for both metrics. So far in 2015 the market has only experienced 3 sales, all of smaller, non-institutionally sized assets – likely explaining the drop-off from 2014 pricing levels. Cap rates have ticked down by 30 BP.
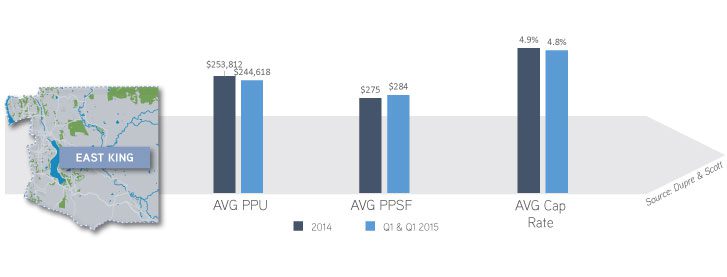
East King County
Sales metrics in East King County in 2015 nearly mirror 2014 exactly. Sales on a PPU basis are within 3.6% of 2014 levels and sales on a PPSF basis have increased an average of 3.3% in 2015. Average cap rates are within 10 BP from last year. So far in 2015, 3 of the 4 sales are of properties larger than 150 units, all with pricing greater than $40M.
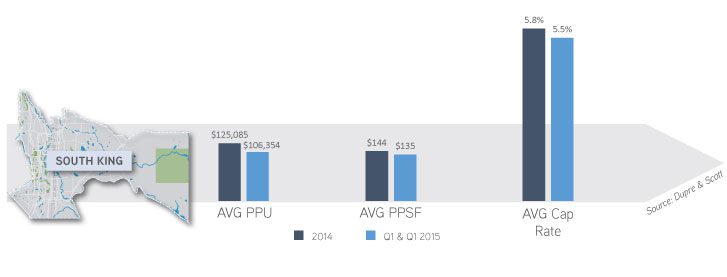
South King County
Outside of Urban King County, South King County has experienced the greatest number of trades during the first half of 2015, 14 sales versus 9 sales, respectively. Although sales metrics in Urban King County have surged, South King County has held strong, yet without appreciable upward pressure on pricing. Sales on a PPU and PPSF are similar to those experienced in 2014, yet cap rates have compressed by an average of 30 BP.
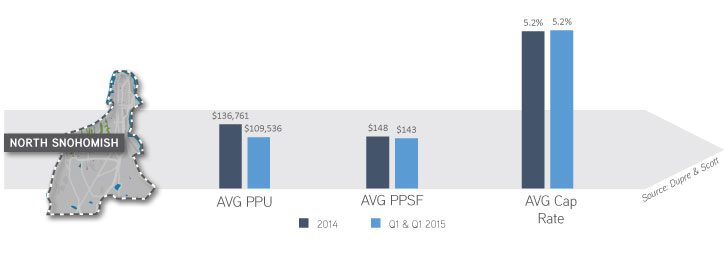
North Snohomish County
North Snohomish County is another market with slow sales volume YTD and all three sales recorded are of buildings comprised of less than 150 units. So far in 2015, sales on a unit-count basis have yet to hit 250 units! Accordingly, it is not surprising that pricing is similar to 2014 and a touch below on a PPU and PPSF basis. Cap rates in 2015 mirror those from 2014.
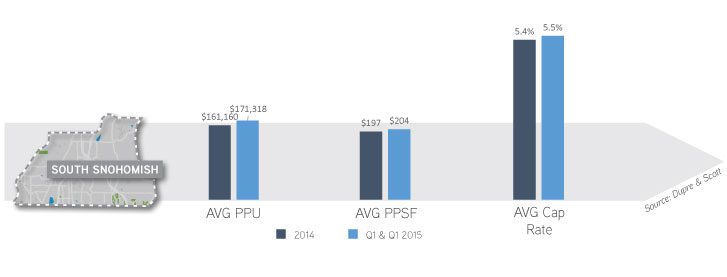
South Snohomish County
So far in 2015, sales in South Snohomish County show an escalating market with pricing levels exceeding those reached in 2014. Although gains on a PPU and PPSF basis are moderate, they prove a historical trend of a continually rising market. Only three sales are recorded for the first half of 2015, two of which are of institutionally-sized assets. Cap rates are within 10 BP from 2014 to 2015.
The year is far from over and given the amount of product currently on the market, sales volume is very likely to increase during the second half of 2015, with certain markets set to break historic sales records. Please contact me to discuss your acquisition and disposition strategies for the balance of the year and to formulate a strategy for market-leading returns.