


Prices always go up – until they don’t. Appreciation of real estate over time serves as a fundamental precept to investment. However, as any seasoned investor (or one scorned by a downturn) will attest, cash flow keeps the lights on and the mortgage paid. So far in 2015, investors are able to maintain current cash flow expectations while paying more for assets than in years past.
Below I provide an analysis of historical and current pricing of apartments, focused on prices on a NRSF and cap rate basis. For those of you looking to cut to the chase, I’ll lead with an overview.
Highlights
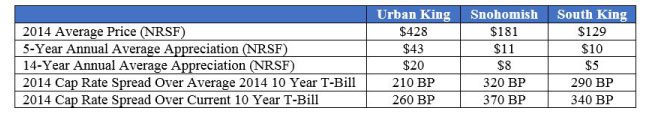
Based on the above, you gain a sense of the momentum in current pricing and also the consistency in pricing differentials between the chosen three markets. From the cap rate vs. T-Bill analysis one can conclude that investors have a debt arbitrage opportunity in 2015; however, this advantage is stymied by demand in the marketplace.
Demand for apartment assets is at an all-time high and as a result investors are willing to chase cap rates down to similar yield-over-treasury spreads as seen in 2014. The result presents an interesting dichotomy: investors can achieve similar yields to those accepted in previous years of this cycle (namely 2012 – 2014), yet asset prices continue to increase (and not necessarily based on NOI growth).
Let’s take a look at how these fundamentals have influenced individual markets and how asset values have trended over time.
Urban King County
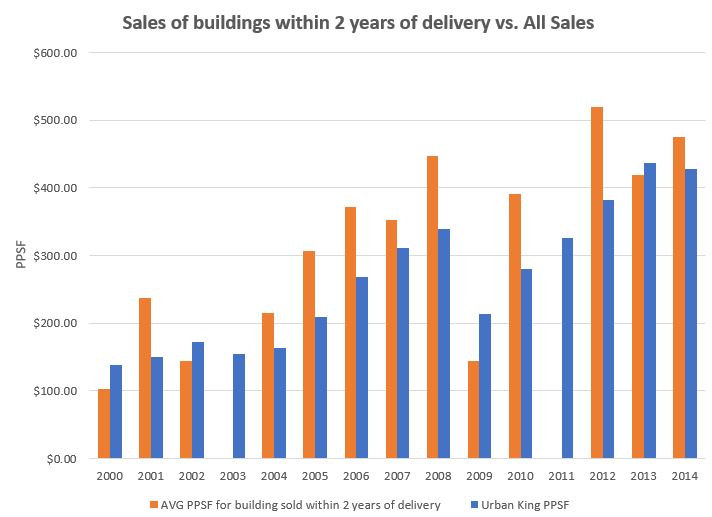
Urban markets within King County have undoubtedly displayed the greatest growth over the last 14 years. In the last 5 years, values on a price/NRSF basis have doubled ($43/year annual growth) versus the 14 year run ($20/year annual growth).
This particular market does have some distortion as a result of newer assets brought to market upon stabilization (or in many cases, sold as a presale). The below graph shows both annual NRSF increases as well as the influence of newer assets sold.
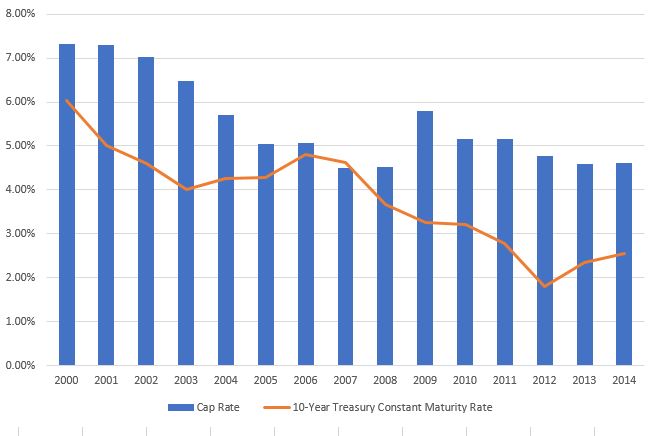
The following graph highlights differentials between cap rates and the 10-Year Treasury. In 10 of the last 14 years, spreads indicate that investors will chase the treasury – leading to a conclusion of possible cap rate compression in 2015 and the concomitant price appreciation discussed above.
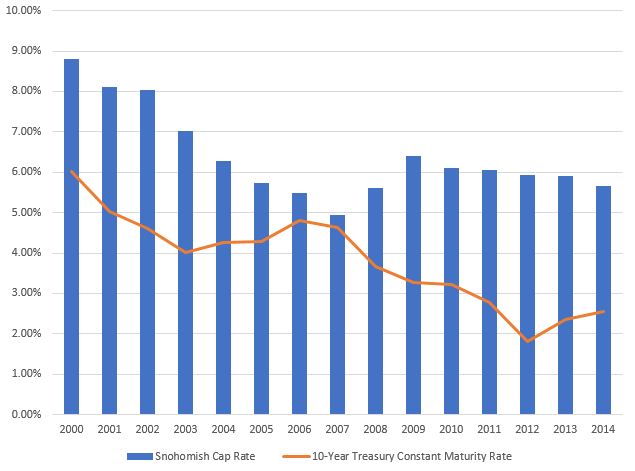
Snohomish County
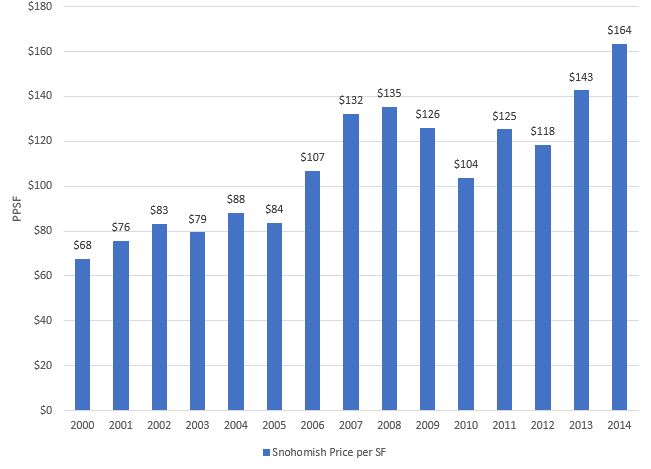
Asset appreciation in Snohomish County exhibited a similar trend to King County – annual average NRSF price increases in the last 5 years grew 30% more than over a 14 year run – showing greater value acceleration in recent years. Yet, in absolute dollars, the gains are only ¼ of that of Urban King County.
Analyzing spreads between cap rates and the 10-Year Treasury, Snohomish County has maintained the largest spreads, yet momentum in this market may prove to close that gap in 2015 and drive cap rates further south.
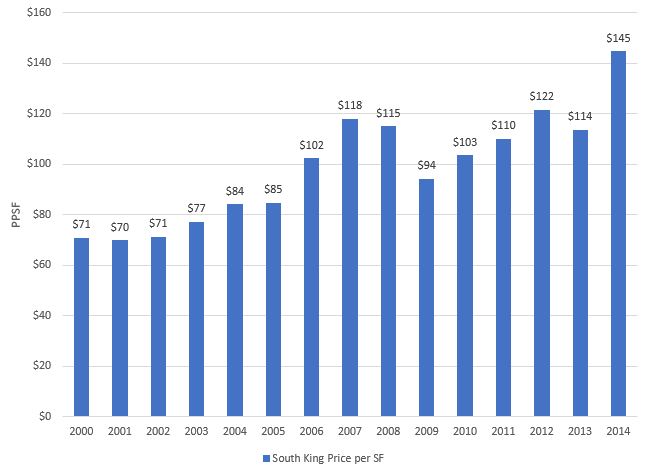
South King County
South King County experienced the least asset appreciation over the last 14 years, yet again trends show 5 year average annual growth double that of annual growth in the last 14 – proving more price acceleration in this market as well. Although far behind Urban King County, value growth in South King County nearly matches the NRSF price appreciation in Snohomish exactly over the last 5 years — $10/year versus $11/year.
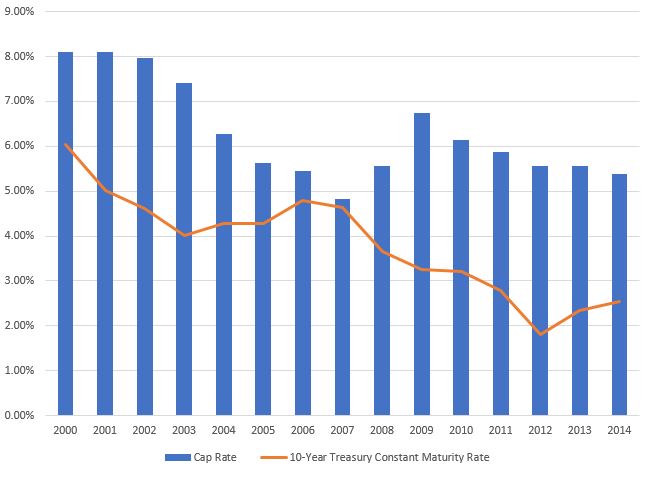
Cap rate trends versus the 10-Year Treasury in South King County are nearly identical to that of Snohomish County. Yet, the spread over the 10-Year Treasury in 2014 was tighter in South King County than Snohomish County by 30 BP. One may conclude that investors have hit their limits in South King County or that the greater acceleration in asset appreciation justifies pushing cap rates lower – so long as yield requirements are met.
Is it That Simple?
It would be naïve to think that the market is without headwinds or risk. Continued investor appetite for deal metrics discussed above assumes the market is not adversely impacted by the region’s sizable development pipeline, concessions and vacancy mounting since Q4 2014 do not erode investor confidence and a dislocation between asset pricing and replacement cost does not put a cap on prices. As well, any upward rate trends will substantially change the game.
The take-away for now is that it is a tremendously good time to sell an apartment building. Investors are validating higher purchase prices based on maintaining acceptable levels of yield and paying for the opportunity to participate in the fundamentals of our market.
Please give me a call to discuss the above trends and analysis and also discuss your investment goals and objectives as we get further into a great 2015.