

The past week provides a great amount of significant data from a litany of important sources. The apartment development, investment and ownership community has no shortage of key fundamentals and indices to watch – here are few recently released statements and reports that I find significant.
Second Quarter 2014 [third Estimate] GDP Figures
From an economic analysis perspective, we as a nation are somewhat Gross Domestic Product (GDP) obsessed – and rightfully so. As 2/3 of GDP is based on consumer spending, and consumer spending is a fantastic metric for dollars left in our pockets after paying rent/bills/incidentals – it is an important gauge of the health of our economy.
This morning the Bureau of Economic Analysis release the Second Quarter 2014 results for estimated GDP growth, clocking in at a revised figure of 4.6%, on an annualized basis. Not only does this beat Q1 results – which shockingly decreased by 2.1% – Q2 marks the largest gain in the last two years and one the largest gains since the 2009 recession. You can subscribe to BEA releases of GDP figures, and various other reports, directly at their website.
GDP momentum is good and as it is intrinsically tied to consumer spending, so is the Consumer Sentiment poll, which rose to nearly 85% in September – one of the highest level since 2007.
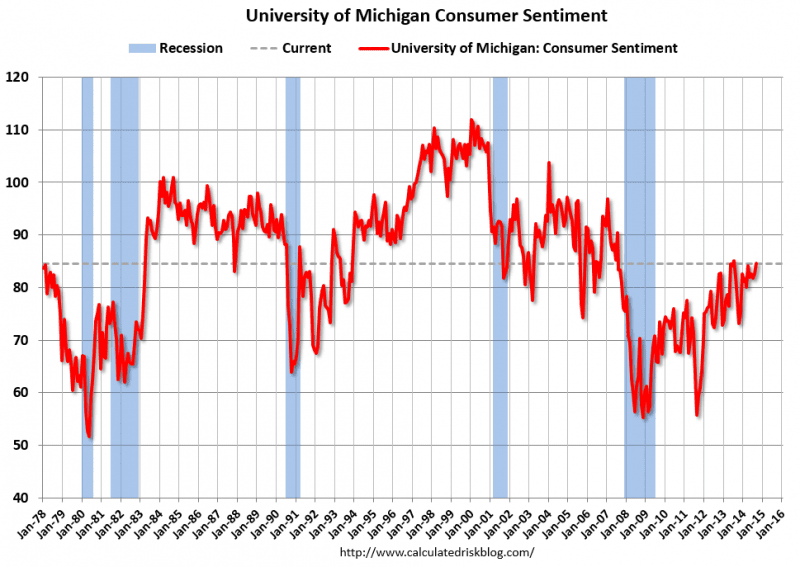
I often find data such as the Consumer Sentiment poll at the Calculated Risk Blog, where I also find other helpful tools in analyzing overall economic health of various markets. You can find a list of my favorite economic analysis tools on the Resources Page of my blog.
The FOMC & Timing of Increased Interest Rates
Although dated by just over a week, last Wednesday the Federal Open Markets Committee (FOMC) released its meeting notes, providing guidance on when it is likely to raise interest rates. As we have come to know, the Federal Reserve continues to monitor the health of the economy – and as a major indicator of such health, unemployment.
Although 6.5% unemployment was a previous target for beginning to increase interest rates, it is obvious from the below chart that we are well below that figure and rates remain low.
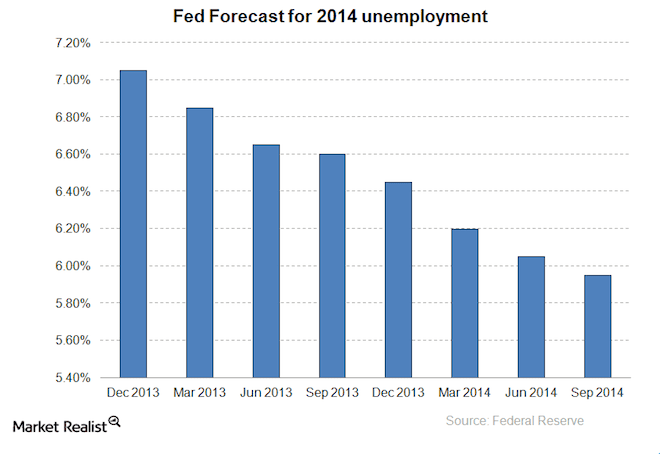
The guidance at the point remains the almost comical terminology “considerable” – meaning, rates will remain low for a “considerable” time after the Federal Reserve considers the US economy in good health, which based on its Press Release and Business Insider Commentary what we are experiencing right now is not considered good health. Stay tuned, but my bet is on a low cap rate environment for real estate investors well into 2015 as rates remain low.
Seattle vs. US – and MORE Data
September and March are often my favorite months and this does not correlate to the start or end of a sports season. Dupre + Scott releases their semi-annual reports of Rent Growth & Vacancy Rates and Development during these times. If you are not familiar with their reports, you should cursor over to www.duprescott.com and become a subscriber today. They provide a huge quantum of highly accurate data and they are a favorite of nearly every seasoned apartment investors in Puget Sound (no, Mike did not pay me to write this).
Given the volume of data provided in these reports, there is no simple way to condense all current trends, so I will stick with the big picture – which is a very good picture.
Seattle Fundamentals
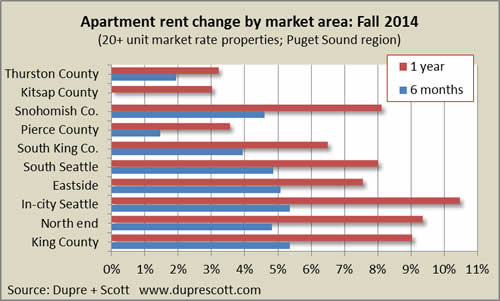
Seattle is firing on all cylinders and the market continues to outperform on all metrics – nation leading rent growth, low vacancy and historic level of deliveries absorbed without rental rate decline (for the most part – sorry Ballard). The following chart on rent growth tells a great story of how vibrant the market is and also validates an early thesis, Snohomish County is a fantastic place to invest right now.
Often times rising rents lead to commensurately rising vacancy. However, in a market as strong as ours, occupancy has held at historically high rates.
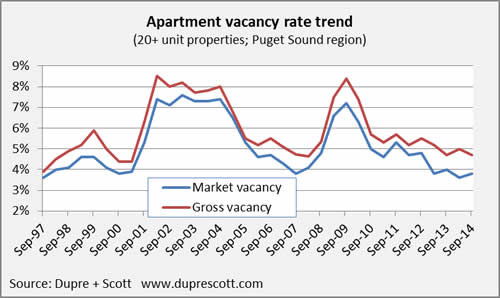
And the final leg of the stool is the apartment development pipeline. With anticipated delivery of a historic number of apartment units from 2014 – 2017, and nearly 8,000 units delivered to our market in 2013, many have expressed concern of sliding rent growth and increased vacancy. Yet, as we indicate above, our market remains vibrant. Based on the following, we are not yet out of harm’s way.
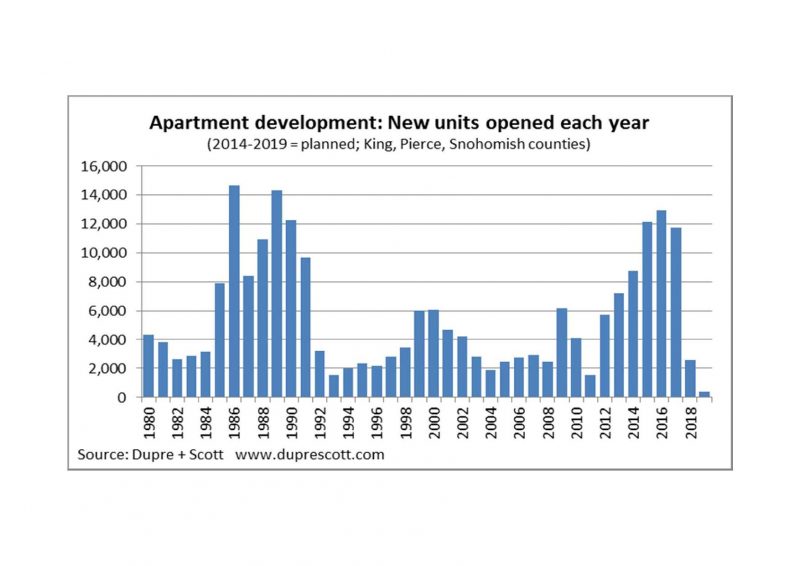
Myriad analyses can be drawn from the data provided and this is not a forum where we can perform anything other than a cursory review. You can find the source set for these slides from Dupre + Scott here and I can assist with a more granular level of analysis to help you with your individual investment strategies. As well, earlier this week my friend Marc Stiles also wrote a great article on this topic titled: What apartment glut?.
National Fundamentals
Last week the National Multifamily Housing Council (NMHC) held its Board of Directors and Advisory Committee Meeting, and out of which they released data on the health of the national apartment sector and the US economy as a whole. You can access the full slide presentation here.
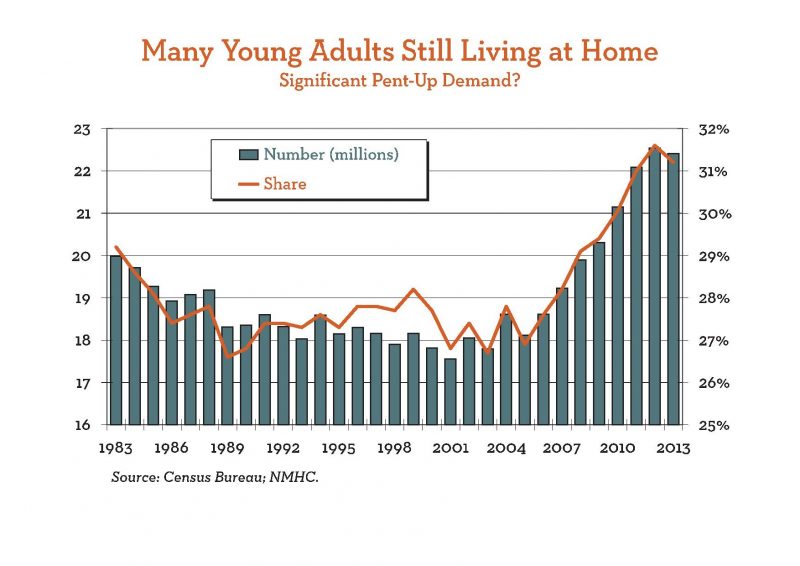
As a snapshot of their findings, I am proving a few slides to exhibit the overall health of the apartment sector. First of which provides some critical data on the demand side.
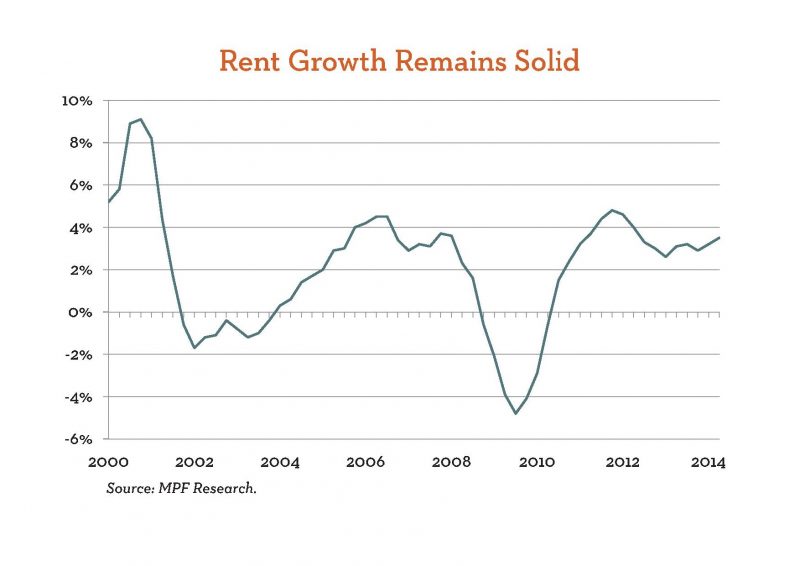
On a national basis, apartment rent growth continues to rise. However, in the context of rent growth we are experiencing in Seattle, it appears quite tepid. As of this month, it was reported that Seattle is one of the most expensive cities for renters in the nation: Top 10 Rents by City.
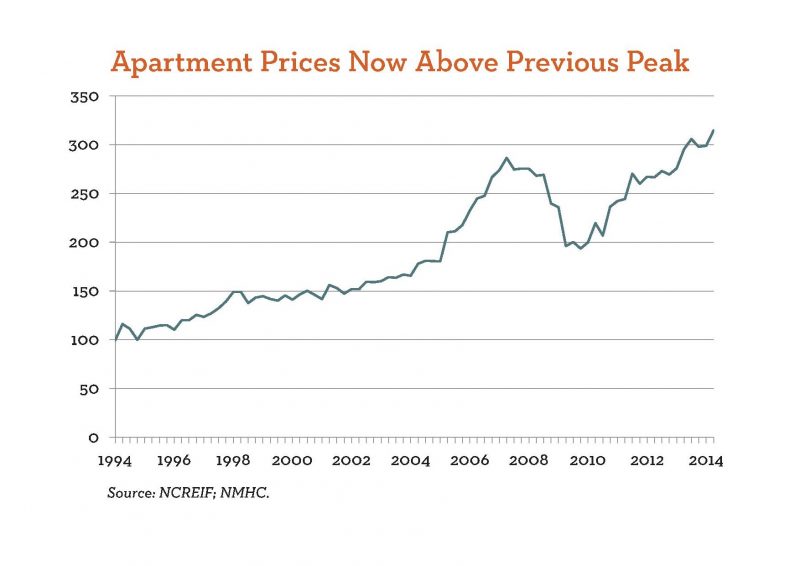
And finally, I will leave you with a cautionary tale … pricing has exceed the previous peak in 2007. But this time is different, right?